Version published:
August 3, 2026 - 10:16pm
August 3, 2026 - 10:14pm
August 3, 2026 - 10:13pm
August 3, 2026 - 10:10pm
August 3, 2026 - 10:09pm
June 17, 2026 - 10:03pm
June 17, 2026 - 10:02pm
May 31, 2026 - 9:31pm
May 22, 2026 - 6:29pm
May 22, 2026 - 6:14pm
May 22, 2026 - 6:13pm
May 16, 2026 - 11:40pm
May 4, 2026 - 2:15pm
April 30, 2026 - 2:09am
April 30, 2026 - 2:09am
April 29, 2026 - 4:35pm
April 27, 2026 - 10:56pm
Context
Adding seaweed to livestock feed could reduce agriculture’s carbon footprint by partially replacing conventional feed ingredients (like soy and corn) and/or improving feed conversion ratios so animals need less feed to reach market weight (Costa et al., 2021; Hofmann et al., 2025).
Studies have flagged feed conversion ratios (FCRs) as a key driver in mitigating emissions due to animal feed. The Seaweed Company has stated that their products can improve FCR by 3–10% in swine farms, reducing the carbon footprint of 100,000 pigs by up to 18,000 tons CO2e per year (as stated in World Bank, 2023). If applied worldwide in 2024, it could have mitigated approximately 191,003 tons CO2e. More studies have been done replacing soy protein with seaweed for fish feed and that will be the basis for the calculations below. The global aquaculture sector generates approximately 64 Mt CO2e per year, with feed production — particularly soy protein concentrate — representing a dominant emissions driver. Seaweed-based protein offers a partial substitution pathway for soy in fish feed.
Key Findings and Limitations of Existing Life Cycle Assessments
Multiple life cycle assessments (LCAs) have flagged energy consumption in seaweed drying and pelletizing and resourcing wild harvest versus cultivated seaweed as climate impact drivers (e.g., Halfdanarson et al., 2019; Coelho et al., 2022; Koesling et al., 2021; Wu et al., 2025).
However, LCAs to date are incomplete in several respects. First, they do not cover the full end-to-end product lifecycle, including emissions in the cultivation process, and product end-use (Chaurasiya et al., 2026). Second, indirect land use change may not be fully incorporated: for example, when seaweed replaces soy protein, there is less pressure to clear forests to grow soybeans, thus creating an additional mitigation benefit. Third, seaweed products are increasingly marketed as alternatives to synthetic antibiotics in livestock, but the upstream emissions from antibiotic manufacture and the downstream benefits of antibiotic reduction are absent from available LCAs, making direct like-for-like comparison impossible with regards to climate impact.
Emissions Reduction Potential
Note: The mitigation potential estimates presented here are screening-level calculations to establish order-of-magnitude plausibility under specific adoption scenarios. Each estimate is derived by combining published or estimated values for current or forecasted seaweed-based product emissions performance in currently available LCAs (e.g., methane reduction per animal, GHG intensity relative to a displaced product) with assumptions about adoption rates and addressable market size.
| Scenario |
Basis / Source |
Feasibility-adjusted (×0.75) Mt CO2e/yr |
Key condition |
| Base Case |
Koesling et al., 2021 |
0 (net climate increase: +28.8 kg CO2e/kg protein vs soy) |
Non-renewable energy |
| 2030 Scenario — renewable energy; S. latissima to L. digitata range |
Seghetta et al., 2017+ WB (2023) |
~0.009-0.035 Mt CO2e/yr |
Renewable energy is prerequisite |
| Theoretical upper bound value |
Seghetta et al., 2017; extrapolated to full cultivation area |
~0.27–1.07 Mt CO2e/yr |
Renewable energy; Theoretical value depicting current maximum scale |
Evidence Base
(Seghetta et al., 2017), working with Danish cultivation systems on a predominantly renewable grid, find that substituting soy with Saccharina latissima protein reduces emissions by 300 kg CO2e per hectare of cultivation per year; using Laminaria digitata the emissions reduction rises to 1,230 kg CO2e/ha/yr, reflecting that species’ higher protein yield.
(Koesling et al., 2021) however shows that under the scenario of a Norwegian grid with fossil inputs, S. latissima protein generates +28.8 kg CO2e per kg crude protein — a net emissions increase versus soy. The majority of global seaweed production occurs in China, Indonesia, and the Philippines where grid electricity is substantially more carbon-intensive than Norway, meaning the (Koesling et al., 2021) base case is closer to current reality for most global production than the (Seghetta et al., 2017) Danish renewable scenario.
Three systematic omissions mean current figures are conservative even when conditions are met. First, indirect land-use change (iLUC): when seaweed replaces soy, reduced demand decreases pressure on land clearing in Brazil and Southeast Asia; Brazilian soy iLUC emissions are estimated at 4–12 t CO2ee per hectare of soy displaced which is a benefit absent from current LCAs. Second, antibiotic avoidance: seaweed-based feed additives reduce synthetic antibiotic use, whose upstream production carries its own emissions footprint. Third, feed conversion ratio improvement: a 10% FCR reduction in aquaculture reduces environmental impacts by up to 24%, but this is not considered.
Calculation
| Parameter |
Value |
Note |
| Functional unit |
kg CO2e per ha cultivation area / yr (Seghetta et al., 2017) |
Per-ha basis; though Koesling et al., 2021 uses per-kg-protein basis |
| Displacement factor |
300–1,230 kg CO2e/ha/yr (S. latissima to L. digitata) |
Seghetta et al., 2017; Danish renewable grid |
| Global seaweed cultivation area and production (2023) |
~1.1 million ha and 36 Mtons ww |
DeAngelo et al., 2023 |
| WB (2023) market volume |
$1,122M ÷ $12/kg = ~93,500 t product → ~935,000 t ww (assuming product is dried seaweed meal at 10% of ww) → ~28570 ha equiv. |
World Bank, 2023 |
| Gross mitigation (World Bank central; renewable) |
28570 ha × 300–1,230 kg CO2e/ha = ~0.009–0.035 Mt CO2e/yr |
Seghetta et al., 2017;Danish renewable grid |
A theoretical long-term anchor is total cultivation area:
| Calculation |
Value |
| Total global cultivation area 2023 |
~1.1M ha |
| Potential cultivation area in 2050 |
9M ha |
| If 10% of all area is used for fish feed substitution (renewable energy; S. latissima) |
0.9M × 300 = 330,000 t CO2e/yr = 0.27 Mt CO2e/yr |
| If all area used for fish feed substitution (renewable energy; L. digitata) |
0.9M × 1,230 = 1,107,000 t CO2e/yr = 1.07 Mt CO2e/yr |
Context
Adding seaweed to livestock feed could reduce agriculture’s carbon footprint by partially replacing conventional feed ingredients (like soy and corn) and/or improving feed conversion ratios so animals need less feed to reach market weight (
Costa et al., 2021;
Hofmann et al., 2025).
Studies have flagged feed conversion ratios (FCRs) as a key driver in mitigating emissions due to animal feed. The Seaweed Company has stated that their products can improve FCR by 3–10% in swine farms, reducing the carbon footprint of 100,000 pigs by up to 18,000 tons CO
2e per year (as stated in
World Bank, 2023). If applied worldwide in 2024, it could have mitigated approximately 191,003 tons CO
2e. More studies have been done replacing soy protein with seaweed for fish feed and that will be the basis for the calculations below. The global aquaculture sector generates approximately 64 Mt
CO2e per year, with feed production — particularly soy protein concentrate — representing a dominant emissions driver. Seaweed-based protein offers a partial substitution pathway for soy in fish feed.
Key Findings and Limitations of Existing Life Cycle Assessments
Multiple life cycle assessments (LCAs) have flagged energy consumption in seaweed drying and pelletizing and resourcing wild harvest versus cultivated seaweed as climate impact drivers (e.g.,
Halfdanarson et al., 2019;
Coelho et al., 2022;
Koesling et al., 2021;
Wu et al., 2025).
However, LCAs to date are incomplete in several respects. First, they do not cover the full end-to-end product lifecycle, including emissions in the cultivation process, and product end-use (
Chaurasiya et al., 2026). Second, indirect land use change may not be fully incorporated: for example, when seaweed replaces soy protein, there is less pressure to clear forests to grow soybeans, thus creating an additional mitigation benefit. Third, seaweed products are increasingly marketed as alternatives to synthetic antibiotics in livestock, but the upstream emissions from antibiotic manufacture and the downstream benefits of antibiotic reduction are absent from available LCAs, making direct like-for-like comparison impossible with regards to climate impact.
Emissions Reduction Potential
Note: The mitigation potential estimates presented here are screening-level calculations to establish order-of-magnitude plausibility under specific adoption scenarios. Each estimate is derived by combining published or estimated values for current or forecasted seaweed-based product emissions performance in currently available LCAs (e.g., methane reduction per animal, GHG intensity relative to a displaced product) with assumptions about adoption rates and addressable market size.
| Scenario |
Basis / Source |
Feasibility-adjusted (×0.75) Mt CO2e/yr |
Key condition |
| Base Case |
Koesling et al., 2021 |
0 (net climate increase: +28.8 kg CO2e/kg protein vs soy) |
Non-renewable energy |
| 2030 Scenario — renewable energy; S. latissima to L. digitata range |
Seghetta et al., 2017+ WB (2023) |
~0.009-0.035 Mt CO2e/yr |
Renewable energy is prerequisite |
| Theoretical upper bound value |
Seghetta et al., 2017; extrapolated to full cultivation area |
~0.27–1.07 Mt CO2e/yr |
Renewable energy; Theoretical value depicting current maximum scale |
Evidence Base
(Seghetta et al., 2017), working with Danish cultivation systems on a predominantly renewable grid, find that substituting soy with
Saccharina latissima protein reduces emissions by 300 kg
CO2e per hectare of cultivation per year; using
Laminaria digitata the emissions reduction rises to 1,230 kg
CO2e/ha/yr, reflecting that species' higher protein yield.
(
Koesling et al., 2021) however shows that under the scenario of a Norwegian grid with fossil inputs,
S. latissima protein generates
+28.8 kg CO2e per kg crude protein — a net emissions
increase versus soy. The majority of global seaweed production occurs in China, Indonesia, and the Philippines where grid electricity is substantially more carbon-intensive than Norway, meaning the (
Koesling et al., 2021) base case is closer to current reality for most global production than the
(Seghetta et al., 2017) Danish renewable scenario.
Three systematic omissions mean current figures are conservative even when conditions are met. First, indirect land-use change (iLUC): when seaweed replaces soy, reduced demand decreases pressure on land clearing in Brazil and Southeast Asia; Brazilian soy iLUC emissions are estimated at 4–12 t
CO2ee per hectare of soy displaced which is a benefit absent from current LCAs. Second, antibiotic avoidance: seaweed-based feed additives reduce synthetic antibiotic use, whose upstream production carries its own emissions footprint. Third, feed conversion ratio improvement: a 10% FCR reduction in aquaculture reduces environmental impacts by up to 24%, but this is not considered.
Calculation
| Parameter |
Value |
Note |
| Functional unit |
kg CO2e per ha cultivation area / yr (Seghetta et al., 2017) |
Per-ha basis; though Koesling et al., 2021 uses per-kg-protein basis |
| Displacement factor |
300–1,230 kg CO2e/ha/yr (S. latissima to L. digitata) |
Seghetta et al., 2017; Danish renewable grid |
| Global seaweed cultivation area and production (2023) |
~1.1 million ha and 36 Mtons ww |
DeAngelo et al., 2023 |
| WB (2023) market volume |
$1,122M ÷ $12/kg = ~93,500 t product → ~935,000 t ww (assuming product is dried seaweed meal at 10% of ww) → ~28570 ha equiv. |
World Bank, 2023 |
| Gross mitigation (World Bank central; renewable) |
28570 ha × 300–1,230 kg CO2e/ha = ~0.009–0.035 Mt CO2e/yr |
Seghetta et al., 2017;Danish renewable grid |
A theoretical long-term anchor is total cultivation area:
| Calculation |
Value |
| Total global cultivation area 2023 |
~1.1M ha |
| Potential cultivation area in 2050 |
9M ha |
| If 10% of all area is used for fish feed substitution (renewable energy; S. latissima) |
0.9M × 300 = 330,000 t CO2e/yr = 0.27 Mt CO2e/yr |
| If all area used for fish feed substitution (renewable energy; L. digitata) |
0.9M × 1,230 = 1,107,000 t CO2e/yr = 1.07 Mt CO2e/yr |
Context
Adding seaweed to livestock feed could reduce agriculture’s carbon footprint by partially replacing conventional feed ingredients (like soy and corn) and/or improving feed conversion ratios so animals need less feed to reach market weight (
Costa et al., 2021;
Hofmann et al., 2025).
Studies have flagged feed conversion ratios (FCRs) as a key driver in mitigating emissions due to animal feed. The Seaweed Company has stated that their products can improve FCR by 3–10% in swine farms, reducing the carbon footprint of 100,000 pigs by up to 18,000 tons CO
2e per year (as stated in
World Bank, 2023). If applied worldwide in 2024, it could have mitigated approximately 191,003 tons CO
2e. More studies have been done replacing soy protein with seaweed for fish feed and that will be the basis for the calculations below. The global aquaculture sector generates approximately 64 Mt
CO2e per year, with feed production — particularly soy protein concentrate — representing a dominant emissions driver. Seaweed-based protein offers a partial substitution pathway for soy in fish feed.
Key Findings and Limitations of Existing Life Cycle Assessments
Multiple life cycle assessments (LCAs) have flagged energy consumption in seaweed drying and pelletizing and resourcing wild harvest versus cultivated seaweed as climate impact drivers (e.g.,
Halfdanarson et al., 2019;
Coelho et al., 2022;
Koesling et al., 2021;
Wu et al., 2025).
However, LCAs to date are incomplete in several respects. First, they do not cover the full end-to-end product lifecycle, including emissions in the cultivation process, and product end-use (
Chaurasiya et al., 2026). Second, indirect land use change may not be fully incorporated: for example, when seaweed replaces soy protein, there is less pressure to clear forests to grow soybeans, thus creating an additional mitigation benefit. Third, seaweed products are increasingly marketed as alternatives to synthetic antibiotics in livestock, but the upstream emissions from antibiotic manufacture and the downstream benefits of antibiotic reduction are absent from available LCAs, making direct like-for-like comparison impossible with regards to climate impact.
Emissions Reduction Potential
Note: The mitigation potential estimates presented here are screening-level calculations to establish order-of-magnitude plausibility under specific adoption scenarios. Each estimate is derived by combining published or estimated values for current or forecasted seaweed-based product emissions performance in currently available LCAs (e.g., methane reduction per animal, GHG intensity relative to a displaced product) with assumptions about adoption rates and addressable market size.
| Scenario |
Basis / Source |
Feasibility-adjusted (×0.75) Mt CO2e/yr |
Key condition |
| Base Case |
Koesling et al., 2021 |
0 (net climate increase: +28.8 kg CO2e/kg protein vs soy) |
Non-renewable energy |
| 2030 Scenario — renewable energy; S. latissima to L. digitata range |
Seghetta et al., 2017+ WB (2023) |
~0.009-0.035 Mt CO2e/yr |
Renewable energy is prerequisite |
| Theoretical upper bound value |
Seghetta et al., 2017; extrapolated to full cultivation area |
~0.27–1.07 Mt CO2e/yr |
Renewable energy; Theoretical value depicting current maximum scale |
Evidence Base
(Seghetta et al., 2017), working with Danish cultivation systems on a predominantly renewable grid, find that substituting soy with
Saccharina latissima protein reduces emissions by 300 kg
CO2e per hectare of cultivation per year; using
Laminaria digitata the emissions reduction rises to 1,230 kg
CO2e/ha/yr, reflecting that species' higher protein yield.
(
Koesling et al., 2021) however shows that under the scenario of a Norwegian grid with fossil inputs,
S. latissima protein generates
+28.8 kg CO2e per kg crude protein — a net emissions
increase versus soy. The majority of global seaweed production occurs in China, Indonesia, and the Philippines where grid electricity is substantially more carbon-intensive than Norway, meaning the (
Koesling et al., 2021) base case is closer to current reality for most global production than the
(Seghetta et al., 2017) Danish renewable scenario.
Three systematic omissions mean current figures are conservative even when conditions are met. First, indirect land-use change (iLUC): when seaweed replaces soy, reduced demand decreases pressure on land clearing in Brazil and Southeast Asia; Brazilian soy iLUC emissions are estimated at 4–12 t
CO2ee per hectare of soy displaced which is a benefit absent from current LCAs. Second, antibiotic avoidance: seaweed-based feed additives reduce synthetic antibiotic use, whose upstream production carries its own emissions footprint. Third, feed conversion ratio improvement: a 10% FCR reduction in aquaculture reduces environmental impacts by up to 24%, but this is not considered.
Calculation
| Parameter |
Value |
Note |
| Functional unit |
kg CO2e per ha cultivation area / yr (Seghetta et al., 2017) |
Per-ha basis; though Koesling et al., 2021 uses per-kg-protein basis |
| Displacement factor |
300–1,230 kg CO2e/ha/yr (S. latissima to L. digitata) |
Seghetta et al., 2017; Danish renewable grid |
| Global seaweed cultivation area and production (2023) |
~1.1 million ha and 36 Mtons ww |
DeAngelo et al., 2023 |
| WB (2023) market volume |
$1,122M ÷ $12/kg = ~93,500 t product → ~935,000 t ww (assuming product is dried seaweed meal at 10% of ww) → ~28570 ha equiv. |
World Bank, 2023 |
| Gross mitigation (World Bank central; renewable) |
28570 ha × 300–1,230 kg CO2e/ha = ~0.009–0.035 Mt CO2e/yr |
Seghetta et al., 2017;Danish renewable grid |
A theoretical long-term anchor is total cultivation area:
| Calculation |
Value |
| Total global cultivation area 2023 |
~1.1M ha |
| Potential cultivation area in 2050 |
9M ha |
| If 10% of all area is used for fish feed substitution (renewable energy; S. latissima) |
0.9M × 300 = 330,000 t CO2e/yr = 0.27 Mt CO2e/yr |
| If all area used for fish feed substitution (renewable energy; L. digitata) |
0.9M × 1,230 = 1,107,000 t CO2e/yr = 1.07 Mt CO2e/yr |
Context
Adding seaweed to livestock feed could reduce agriculture’s carbon footprint by partially replacing conventional feed ingredients (like soy and corn) and/or improving feed conversion ratios so animals need less feed to reach market weight (
Costa et al., 2021;
Hofmann et al., 2025).
Studies have flagged feed conversion ratios (FCRs) as a key driver in mitigating emissions due to animal feed. The Seaweed Company has stated that their products can improve FCR by 3–10% in swine farms, reducing the carbon footprint of 100,000 pigs by up to 18,000 tons CO
2e per year (as stated in
World Bank, 2023). If applied worldwide in 2024, it could have mitigated approximately 191,003 tons CO
2e. More studies have been done replacing soy protein with seaweed for fish feed and that will be the basis for the calculations below. The global aquaculture sector generates approximately 64 Mt
CO2e per year, with feed production — particularly soy protein concentrate — representing a dominant emissions driver. Seaweed-based protein offers a partial substitution pathway for soy in fish feed.
Key Findings and Limitations of Existing Life Cycle Assessments
Multiple life cycle assessments (LCAs) have flagged energy consumption in seaweed drying and pelletizing and resourcing wild harvest versus cultivated seaweed as climate impact drivers (e.g.,
Halfdanarson et al., 2019;
Coelho et al., 2022;
Koesling et al., 2021;
Wu et al., 2025).
However, LCAs to date are incomplete in several respects. First, they do not cover the full end-to-end product lifecycle, including emissions in the cultivation process, and product end-use (
Chaurasiya et al., 2026). Second, indirect land use change may not be fully incorporated: for example, when seaweed replaces soy protein, there is less pressure to clear forests to grow soybeans, thus creating an additional mitigation benefit. Third, seaweed products are increasingly marketed as alternatives to synthetic antibiotics in livestock, but the upstream emissions from antibiotic manufacture and the downstream benefits of antibiotic reduction are absent from available LCAs, making direct like-for-like comparison impossible with regards to climate impact.
Emissions Reduction Potential
Note: The mitigation potential estimates presented here are screening-level calculations to establish order-of-magnitude plausibility under specific adoption scenarios. Each estimate is derived by combining published or estimated values for current or forecasted seaweed-based product emissions performance in currently available LCAs (e.g., methane reduction per animal, GHG intensity relative to a displaced product) with assumptions about adoption rates and addressable market size.
| Scenario |
Basis / Source |
Feasibility-adjusted (×0.75) Mt CO2e/yr |
Key condition |
| Base Case |
Koesling et al., 2021 |
0 (net climate increase: +28.8 kg CO2e/kg protein vs soy) |
Non-renewable energy |
| 2030 Scenario — renewable energy; S. latissima to L. digitata range |
Seghetta et al., 2017+ WB (2023) |
~0.009-0.035 Mt CO2e/yr |
Renewable energy is prerequisite |
| Theoretical upper bound value |
Seghetta et al., 2017; extrapolated to full cultivation area |
~0.27–1.07 Mt CO2e/yr |
Renewable energy; Theoretical value depicting current maximum scale |
Evidence Base
(Seghetta et al., 2017), working with Danish cultivation systems on a predominantly renewable grid, find that substituting soy with
Saccharina latissima protein reduces emissions by 300 kg
CO2e per hectare of cultivation per year; using
Laminaria digitata the emissions reduction rises to 1,230 kg
CO2e/ha/yr, reflecting that species' higher protein yield.
(
Koesling et al., 2021) however shows that under the scenario of a Norwegian grid with fossil inputs,
S. latissima protein generates
+28.8 kg CO2e per kg crude protein — a net emissions
increase versus soy. The majority of global seaweed production occurs in China, Indonesia, and the Philippines where grid electricity is substantially more carbon-intensive than Norway, meaning the (
Koesling et al., 2021) base case is closer to current reality for most global production than the
(Seghetta et al., 2017) Danish renewable scenario.
Three systematic omissions mean current figures are conservative even when conditions are met. First, indirect land-use change (iLUC): when seaweed replaces soy, reduced demand decreases pressure on land clearing in Brazil and Southeast Asia; Brazilian soy iLUC emissions are estimated at 4–12 t
CO2ee per hectare of soy displaced which is a benefit absent from current LCAs. Second, antibiotic avoidance: seaweed-based feed additives reduce synthetic antibiotic use, whose upstream production carries its own emissions footprint. Third, feed conversion ratio improvement: a 10% FCR reduction in aquaculture reduces environmental impacts by up to 24%, but this is not considered.
Calculation
| Parameter |
Value |
Note |
| Functional unit |
kg CO2e per ha cultivation area / yr (Seghetta et al., 2017) |
Per-ha basis; though Koesling et al., 2021 uses per-kg-protein basis |
| Displacement factor |
300–1,230 kg CO2e/ha/yr (S. latissima to L. digitata) |
Seghetta et al., 2017; Danish renewable grid |
| Global seaweed cultivation area and production (2023) |
~1.1 million ha and 36 Mtons ww |
DeAngelo et al., 2023 |
| WB (2023) market volume |
$1,122M ÷ $12/kg = ~93,500 t product → ~935,000 t ww (assuming product is dried seaweed meal at 10% of ww) → ~28570 ha equiv. |
World Bank, 2023 |
| Gross mitigation (World Bank central; renewable) |
28570 ha × 300–1,230 kg CO2e/ha = ~0.009–0.035 Mt CO2e/yr |
Seghetta et al., 2017;Danish renewable grid |
A theoretical long-term anchor is total cultivation area:
| Calculation |
Value |
| Total global cultivation area 2023 |
~1.1M ha |
| Potential cultivation area in 2050 |
9M ha |
| If 10% of all area is used for fish feed substitution (renewable energy; S. latissima) |
0.9M × 300 = 330,000 t CO2e/yr = 0.27 Mt CO2e/yr |
| If all area used for fish feed substitution (renewable energy; L. digitata) |
0.9M × 1,230 = 1,107,000 t CO2e/yr = 1.07 Mt CO2e/yr |
Context
Adding seaweed to livestock feed could reduce agriculture’s carbon footprint by partially replacing conventional feed ingredients (like soy and corn) and/or improving feed conversion ratios so animals need less feed to reach market weight (
Costa et al., 2021;
Hofmann et al., 2025).
Studies have flagged feed conversion ratios (FCRs) as a key driver in mitigating emissions due to animal feed. The Seaweed Company has stated that their products can improve FCR by 3–10% in swine farms, reducing the carbon footprint of 100,000 pigs by up to 18,000 tons CO
2e per year (as stated in
World Bank, 2023). If applied worldwide in 2024, it could have mitigated approximately 191,003 tons CO
2e. More studies have been done replacing soy protein with seaweed for fish feed and that will be the basis for the calculations below. The global aquaculture sector generates approximately 64 Mt
CO2e per year, with feed production — particularly soy protein concentrate — representing a dominant emissions driver. Seaweed-based protein offers a partial substitution pathway for soy in fish feed.
Key Findings and Limitations of Existing Life Cycle Assessments
Multiple life cycle assessments (LCAs) have flagged energy consumption in seaweed drying and pelletizing and resourcing wild harvest versus cultivated seaweed as climate impact drivers (e.g.,
Halfdanarson et al., 2019;
Coelho et al., 2022;
Koesling et al., 2021;
Wu et al., 2025).
However, LCAs to date are incomplete in several respects. First, they do not cover the full end-to-end product lifecycle, including emissions in the cultivation process, and product end-use (
Chaurasiya et al., 2026). Second, indirect land use change may not be fully incorporated: for example, when seaweed replaces soy protein, there is less pressure to clear forests to grow soybeans, thus creating an additional mitigation benefit. Third, seaweed products are increasingly marketed as alternatives to synthetic antibiotics in livestock, but the upstream emissions from antibiotic manufacture and the downstream benefits of antibiotic reduction are absent from available LCAs, making direct like-for-like comparison impossible with regards to climate impact.
Emissions Reduction Potential
Note: The mitigation potential estimates presented here are screening-level calculations to establish order-of-magnitude plausibility under specific adoption scenarios. Each estimate is derived by combining published or estimated values for current or forecasted seaweed-based product emissions performance in currently available LCAs (e.g., methane reduction per animal, GHG intensity relative to a displaced product) with assumptions about adoption rates and addressable market size.
| Scenario |
Basis / Source |
Feasibility-adjusted (×0.75) Mt CO2e/yr |
Key condition |
| Base Case |
Koesling et al., 2021 |
0 (net climate increase: +28.8 kg CO2e/kg protein vs soy) |
Non-renewable energy |
| 2030 Scenario — renewable energy; S. latissima to L. digitata range |
Seghetta et al., 2017+ WB (2023) |
~0.009-0.035 Mt CO2e/yr |
Renewable energy is prerequisite |
| Theoretical upper bound value |
(Seghetta et al., 2017)) extrapolated to full cultivation area |
~0.27–1.07 Mt CO2e/yr |
Renewable energy; Theoretical value depicting current maximum scale |
Evidence Base
(Seghetta et al., 2017), working with Danish cultivation systems on a predominantly renewable grid, find that substituting soy with
Saccharina latissima protein reduces emissions by 300 kg
CO2e per hectare of cultivation per year; using
Laminaria digitata the emissions reduction rises to 1,230 kg
CO2e/ha/yr, reflecting that species' higher protein yield.
(
Koesling et al., 2021) however shows that under the scenario of a Norwegian grid with fossil inputs,
S. latissima protein generates
+28.8 kg CO2e per kg crude protein — a net emissions
increase versus soy. The majority of global seaweed production occurs in China, Indonesia, and the Philippines where grid electricity is substantially more carbon-intensive than Norway, meaning the (
Koesling et al., 2021) base case is closer to current reality for most global production than the
(Seghetta et al., 2017) Danish renewable scenario.
Three systematic omissions mean current figures are conservative even when conditions are met. First, indirect land-use change (iLUC): when seaweed replaces soy, reduced demand decreases pressure on land clearing in Brazil and Southeast Asia; Brazilian soy iLUC emissions are estimated at 4–12 t
CO2ee per hectare of soy displaced which is a benefit absent from current LCAs. Second, antibiotic avoidance: seaweed-based feed additives reduce synthetic antibiotic use, whose upstream production carries its own emissions footprint. Third, feed conversion ratio improvement: a 10% FCR reduction in aquaculture reduces environmental impacts by up to 24%, but this is not considered.
Calculation
| Parameter |
Value |
Note |
| Functional unit |
kg CO2e per ha cultivation area / yr (Seghetta et al., 2017) |
Per-ha basis; though Koesling et al., 2021 uses per-kg-protein basis |
| Displacement factor |
300–1,230 kg CO2e/ha/yr (S. latissima to L. digitata) |
(Seghetta et al., 2017);Danish renewable grid |
| Global seaweed cultivation area and production (2023) |
~1.1 million ha and 36 Mtons ww |
DeAngelo et al. (2023) |
| WB (2023) market volume |
$1,122M ÷ $12/kg = ~93,500 t product → ~935,000 t ww (assuming product is dried seaweed meal at 10% of ww) → ~28570 ha equiv. |
WB (2023) |
| Gross mitigation (WB central; renewable) |
28570 ha × 300–1,230 kg CO2e/ha = ~0.009–0.035 Mt CO2e/yr |
(Seghetta et al., 2017);Danish renewable grid |
A theoretical long-term anchor is total cultivation area:
| Calculation |
Value |
| Total global cultivation area 2023 |
~1.1M ha |
| Potential cultivation area in 2050 |
9M ha |
| If 10% of all area is used for fish feed substitution (renewable energy; S. latissima) |
0.9M × 300 = 330,000 t CO2e/yr = 0.27 Mt CO2e/yr |
| If all area used for fish feed substitution (renewable energy; L. digitata) |
0.9M × 1,230 = 1,107,000 t CO2e/yr = 1.07 Mt CO2e/yr |
Context
Adding seaweed to livestock feed could reduce agriculture’s carbon footprint by partially replacing conventional feed ingredients (like soy and corn) and/or improving feed conversion ratios so animals need less feed to reach market weight (
Costa et al., 2021;
Hofmann et al., 2025).
Studies have flagged feed conversion ratios (FCRs) as a key driver in mitigating emissions due to animal feed. The Seaweed Company has stated that their products can improve FCR by 3–10% in swine farms, reducing the carbon footprint of 100,000 pigs by up to 18,000 tons CO
2e per year (as stated in
World Bank, 2023). If applied worldwide in 2024, it could have mitigated approximately 191,003 tons CO
2e. More studies have been done replacing soy protein with seaweed for fish feed and that will be the basis for the calculations below. The global aquaculture sector generates approximately 64 Mt
CO2e per year, with feed production — particularly soy protein concentrate — representing a dominant emissions driver. Seaweed-based protein offers a partial substitution pathway for soy in fish feed.
Key Findings and Limitations of Existing Life Cycle Assessments
Multiple life cycle assessments (LCAs) have flagged energy consumption in seaweed drying and pelletizing and resourcing wild harvest versus cultivated seaweed as climate impact drivers (e.g.,
Halfdanarson et al., 2019;
Coelho et al., 2022;
Koesling et al., 2021;
Wu et al., 2025).
However, LCAs to date are incomplete in several respects. First, they do not cover the full end-to-end product lifecycle, including emissions in the cultivation process, and product end-use (
Chaurasiya et al., 2026). Second, indirect land use change may not be fully incorporated: for example, when seaweed replaces soy protein, there is less pressure to clear forests to grow soybeans, thus creating an additional mitigation benefit. Third, seaweed products are increasingly marketed as alternatives to synthetic antibiotics in livestock, but the upstream emissions from antibiotic manufacture and the downstream benefits of antibiotic reduction are absent from available LCAs, making direct like-for-like comparison impossible with regards to climate impact.
Emissions Reduction Potential
Note: The mitigation potential estimates presented here are screening-level calculations to establish order-of-magnitude plausibility under specific adoption scenarios. Each estimate is derived by combining published or estimated values for current or forecasted seaweed-based product emissions performance in currently available LCAs (e.g., methane reduction per animal, GHG intensity relative to a displaced product) with assumptions about adoption rates and addressable market size.
| Scenario |
Basis / Source |
Feasibility-adjusted (×0.75) Mt CO2e/yr |
Key condition |
| Base Case |
Koesling et al., 2021 |
0 (net climate increase: +28.8 kg CO2e/kg protein vs soy) |
Non-renewable energy |
| 2030 Scenario — renewable energy; S. latissima to L. digitata range |
Seghetta et al., 2017+ WB (2023) |
~0.009-0.035 Mt CO2e/yr |
Renewable energy is prerequisite |
| Theoretical upper bound value |
(Seghetta et al., 2017)) extrapolated to full cultivation area |
~0.27–1.07 Mt CO2e/yr |
Renewable energy; Theoretical value depicting current maximum scale |
Evidence Base
(Seghetta et al., 2017), working with Danish cultivation systems on a predominantly renewable grid, find that substituting soy with
Saccharina latissima protein reduces emissions by 300 kg
CO2e per hectare of cultivation per year; using
Laminaria digitata the emissions reduction rises to 1,230 kg
CO2e/ha/yr, reflecting that species' higher protein yield.
(
Koesling et al., 2021) however shows that under the scenario of a Norwegian grid with fossil inputs,
S. latissima protein generates
+28.8 kg CO2e per kg crude protein — a net emissions
increase versus soy. The majority of global seaweed production occurs in China, Indonesia, and the Philippines where grid electricity is substantially more carbon-intensive than Norway, meaning the (
Koesling et al., 2021) base case is closer to current reality for most global production than the
(Seghetta et al., 2017) Danish renewable scenario.
Three systematic omissions mean current figures are conservative even when conditions are met. First, indirect land-use change (iLUC): when seaweed replaces soy, reduced demand decreases pressure on land clearing in Brazil and Southeast Asia; Brazilian soy iLUC emissions are estimated at 4–12 t
CO2ee per hectare of soy displaced which is a benefit absent from current LCAs. Second, antibiotic avoidance: seaweed-based feed additives reduce synthetic antibiotic use, whose upstream production carries its own emissions footprint. Third, feed conversion ratio improvement: a 10% FCR reduction in aquaculture reduces environmental impacts by up to 24%, but this is not considered.
Calculation
| Parameter |
Value |
Note |
| Functional unit |
kg CO2e per ha cultivation area / yr (Seghetta et al., 2017) |
Per-ha basis; though Koesling et al., 2021 uses per-kg-protein basis |
| Displacement factor |
300–1,230 kg CO2e/ha/yr (S. latissima to L. digitata) |
(Seghetta et al., 2017);Danish renewable grid |
| Global seaweed cultivation area and production (2023) |
~1.1 million ha and 36 Mtons ww |
DeAngelo et al. (2023) |
| WB (2023) market volume |
$1,122M ÷ $12/kg = ~93,500 t product → ~935,000 t ww (assuming product is dried seaweed meal at 10% of ww) → ~28570 ha equiv. |
WB (2023) |
| Gross mitigation (WB central; renewable) |
28570 ha × 300–1,230 kg CO2e/ha = ~0.009–0.035 Mt CO2e/yr |
(Seghetta et al., 2017);Danish renewable grid |
A theoretical long-term anchor is total cultivation area:
| Calculation |
Value |
| Total global cultivation area 2023 |
~1.1M ha |
| Potential cultivation area in 2050 |
9M ha |
| If 10% of all area is used for fish feed substitution (renewable energy; S. latissima) |
0.9M × 300 = 330,000 t CO2e/yr = 0.27 Mt CO2e/yr |
| If all area used for fish feed substitution (renewable energy; L. digitata) |
0.9M × 1,230 = 1,107,000 t CO2e/yr = 1.07 Mt CO2e/yr |
Context
Adding seaweed to livestock feed could reduce agriculture’s carbon footprint by partially replacing conventional feed ingredients (like soy and corn) and/or improving feed conversion ratios so animals need less feed to reach market weight (
Costa et al., 2021;
Hofmann et al., 2025).
Studies have flagged feed conversion ratios (FCRs) as a key driver in mitigating emissions due to animal feed. The Seaweed Company has stated that their products can improve FCR by 3–10% in swine farms, reducing the carbon footprint of 100,000 pigs by up to 18,000 tons CO
2e per year (as stated in
World Bank, 2023). If applied worldwide in 2024, it could have mitigated approximately 191,003 tons CO
2e. More studies have been done replacing soy protein with seaweed for fish feed and that will be the basis for the calculations below. The global aquaculture sector generates approximately 64 Mt
CO2e per year, with feed production — particularly soy protein concentrate — representing a dominant emissions driver. Seaweed-based protein offers a partial substitution pathway for soy in fish feed.
Key Findings and Limitations of Existing Life Cycle Assessments
Multiple life cycle assessments (LCAs) have flagged energy consumption in seaweed drying and pelletizing and resourcing wild harvest versus cultivated seaweed as climate impact drivers (e.g.,
Halfdanarson et al., 2019;
Coelho et al., 2022;
Koesling et al., 2021;
Wu et al., 2025).
However, LCAs to date are incomplete in several respects. First, they do not cover the full end-to-end product lifecycle, including emissions in the cultivation process, and product end-use (
Chaurasiya et al., 2026). Second, indirect land use change may not be fully incorporated: for example, when seaweed replaces soy protein, there is less pressure to clear forests to grow soybeans, thus creating an additional mitigation benefit. Third, seaweed products are increasingly marketed as alternatives to synthetic antibiotics in livestock, but the upstream emissions from antibiotic manufacture and the downstream benefits of antibiotic reduction are absent from available LCAs, making direct like-for-like comparison impossible with regards to climate impact.
Emissions Reduction Potential
Note: The mitigation potential estimates presented here are screening-level calculations to establish order-of-magnitude plausibility under specific adoption scenarios. Each estimate is derived by combining published or estimated values for current or forecasted seaweed-based product emissions performance in currently available LCAs (e.g., methane reduction per animal, GHG intensity relative to a displaced product) with assumptions about adoption rates and addressable market size.
| Scenario |
Basis / Source |
Feasibility-adjusted (×0.75) Mt CO2e/yr |
Key condition |
| Base Case |
Koesling et al., 2021 |
0 (net climate increase: +28.8 kg CO2e/kg protein vs soy) |
Non-renewable energy |
| 2030 Scenario — renewable energy; S. latissima to L. digitata range |
Seghetta et al., 2017+ WB (2023) |
~0.009-0.035 Mt CO2e/yr |
Renewable energy is prerequisite |
| Theoretical upper bound value |
(Seghetta et al., 2017)) extrapolated to full cultivation area |
~0.27–1.07 Mt CO2e/yr |
Renewable energy; Theoretical value depicting current maximum scale |
Evidence Base
(Seghetta et al., 2017), working with Danish cultivation systems on a predominantly renewable grid, find that substituting soy with
Saccharina latissima protein reduces emissions by 300 kg
CO2e per hectare of cultivation per year; using
Laminaria digitata the emissions reduction rises to 1,230 kg
CO2e/ha/yr, reflecting that species' higher protein yield.
(
Koesling et al., 2021) however shows that under the scenario of a Norwegian grid with fossil inputs,
S. latissima protein generates
+28.8 kg CO2e per kg crude protein — a net emissions
increase versus soy. The majority of global seaweed production occurs in China, Indonesia, and the Philippines where grid electricity is substantially more carbon-intensive than Norway, meaning the (
Koesling et al., 2021) base case is closer to current reality for most global production than the
(Seghetta et al., 2017) Danish renewable scenario.
Three systematic omissions mean current figures are conservative even when conditions are met. First, indirect land-use change (iLUC): when seaweed replaces soy, reduced demand decreases pressure on land clearing in Brazil and Southeast Asia; Brazilian soy iLUC emissions are estimated at 4–12 t
CO2ee per hectare of soy displaced which is a benefit absent from current LCAs. Second, antibiotic avoidance: seaweed-based feed additives reduce synthetic antibiotic use, whose upstream production carries its own emissions footprint. Third, feed conversion ratio improvement: a 10% FCR reduction in aquaculture reduces environmental impacts by up to 24%, but this is not considered.
Calculation
| Parameter |
Value |
Note |
| Functional unit |
kg CO2e per ha cultivation area / yr (Seghetta et al., 2017) |
Per-ha basis; though Koesling et al., 2021 uses per-kg-protein basis |
| Displacement factor |
300–1,230 kg CO2e/ha/yr (S. latissima to L. digitata) |
(Seghetta et al., 2017);Danish renewable grid |
| Global seaweed cultivation area and production (2023) |
~1.1 million ha and 36 Mtons ww |
DeAngelo et al. (2023) |
| WB (2023) market volume |
$1,122M ÷ $12/kg = ~93,500 t product → ~935,000 t ww (assuming product is dried seaweed meal at 10% of ww) → ~28570 ha equiv. |
WB (2023) |
| Gross mitigation (WB central; renewable) |
28570 ha × 300–1,230 kg CO2e/ha = ~0.009–0.035 Mt CO2e/yr |
(Seghetta et al., 2017);Danish renewable grid |
A theoretical long-term anchor is total cultivation area:
| Calculation |
Value |
| Total global cultivation area 2023 |
~1.1M ha |
| Potential cultivation area in 2050 |
9M ha |
| If 10% of all area is used for fish feed substitution (renewable energy; S. latissima) |
0.9M × 300 = 330,000 t CO2e/yr = 0.27 Mt CO2e/yr |
| If all area used for fish feed substitution (renewable energy; L. digitata) |
0.9M × 1,230 = 1,107,000 t CO2e/yr = 1.07 Mt CO2e/yr |
Context
Adding seaweed to livestock feed could reduce agriculture’s carbon footprint by partially replacing conventional feed ingredients (like soy and corn) and/or improving feed conversion ratios so animals need less feed to reach market weight (
Costa et al., 2021;
Hofmann et al., 2025).
Studies have flagged feed conversion ratios (FCRs) as a key driver in mitigating emissions due to animal feed. The Seaweed Company has stated that their products can improve FCR by 3–10% in swine farms, reducing the carbon footprint of 100,000 pigs by up to 18,000 tons CO
2e per year (as stated in
World Bank, 2023). If applied worldwide in 2024, it could have mitigated approximately 191,003 tons CO
2e. More studies have been done replacing soy protein with seaweed for fish feed and that will be the basis for the calculations below. The global aquaculture sector generates approximately 64 Mt
CO2e per year, with feed production — particularly soy protein concentrate — representing a dominant emissions driver. Seaweed-based protein offers a partial substitution pathway for soy in fish feed.
Key Findings and Limitations of Existing Life Cycle Assessments
Multiple life cycle assessments (LCAs) have flagged energy consumption in seaweed drying and pelletizing and resourcing wild harvest versus cultivated seaweed as climate impact drivers (e.g.,
Halfdanarson et al., 2019;
Coelho et al., 2022;
Koesling et al., 2021;
Wu et al., 2025).
However, LCAs to date are incomplete in several respects. First, they do not cover the full end-to-end product lifecycle, including emissions in the cultivation process, and product end-use (
Chaurasiya et al., 2026). Second, indirect land use change may not be fully incorporated: for example, when seaweed replaces soy protein, there is less pressure to clear forests to grow soybeans, thus creating an additional mitigation benefit. Third, seaweed products are increasingly marketed as alternatives to synthetic antibiotics in livestock, but the upstream emissions from antibiotic manufacture and the downstream benefits of antibiotic reduction are absent from available LCAs, making direct like-for-like comparison impossible with regards to climate impact.
Emissions Reduction Potential
Note: The mitigation potential estimates presented here are screening-level calculations to establish order-of-magnitude plausibility under specific adoption scenarios. Each estimate is derived by combining published or estimated values for current or forecasted seaweed-based product emissions performance in currently available LCAs (e.g., methane reduction per animal, GHG intensity relative to a displaced product) with assumptions about adoption rates and addressable market size.
| Scenario |
Basis / Source |
Feasibility-adjusted (×0.75) Mt CO2e/yr |
Key condition |
| Base Case |
Koesling et al., 2021 |
0 (net climate increase: +28.8 kg CO2e/kg protein vs soy) |
Non-renewable energy |
| 2030 Scenario — renewable energy; S. latissima to L. digitata range |
Seghetta et al., 2017+ WB (2023) |
~0.009-0.035 Mt CO2e/yr |
Renewable energy is prerequisite |
| Theoretical upper bound value |
(Seghetta et al., 2017)) extrapolated to full cultivation area |
~0.27–1.07 Mt CO2e/yr |
Renewable energy; Theoretical value depicting current maximum scale |
Evidence Base
(Seghetta et al., 2017), working with Danish cultivation systems on a predominantly renewable grid, find that substituting soy with
Saccharina latissima protein reduces emissions by 300 kg
CO2e per hectare of cultivation per year; using
Laminaria digitata the emissions reduction rises to 1,230 kg
CO2e/ha/yr, reflecting that species' higher protein yield.
(
Koesling et al., 2021) however shows that under the scenario of a Norwegian grid with fossil inputs,
S. latissima protein generates
+28.8 kg CO2e per kg crude protein — a net emissions
increase versus soy. The majority of global seaweed production occurs in China, Indonesia, and the Philippines where grid electricity is substantially more carbon-intensive than Norway, meaning the (
Koesling et al., 2021) base case is closer to current reality for most global production than the
(Seghetta et al., 2017) Danish renewable scenario.
Three systematic omissions mean current figures are conservative even when conditions are met. First, indirect land-use change (iLUC): when seaweed replaces soy, reduced demand decreases pressure on land clearing in Brazil and Southeast Asia; Brazilian soy iLUC emissions are estimated at 4–12 t
CO2ee per hectare of soy displaced which is a benefit absent from current LCAs. Second, antibiotic avoidance: seaweed-based feed additives reduce synthetic antibiotic use, whose upstream production carries its own emissions footprint. Third, feed conversion ratio improvement: a 10% FCR reduction in aquaculture reduces environmental impacts by up to 24%, but this is not considered.
Calculation
| Parameter |
Value |
Note |
| Functional unit |
kg CO2e per ha cultivation area / yr (Seghetta et al., 2017) |
Per-ha basis; though Koesling et al., 2021 uses per-kg-protein basis |
| Displacement factor |
300–1,230 kg CO2e/ha/yr (S. latissima to L. digitata) |
(Seghetta et al., 2017);Danish renewable grid |
| Global seaweed cultivation area and production (2023) |
~1.1 million ha and 36 Mtons ww |
DeAngelo et al. (2023) |
| WB (2023) market volume |
$1,122M ÷ $12/kg = ~93,500 t product → ~935,000 t ww (assuming product is dried seaweed meal at 10% of ww) → ~28570 ha equiv. |
WB (2023) |
| Gross mitigation (WB central; renewable) |
28570 ha × 300–1,230 kg CO2e/ha = ~0.009–0.035 Mt CO2e/yr |
(Seghetta et al., 2017);Danish renewable grid |
A theoretical long-term anchor is total cultivation area:
| Calculation |
Value |
| Total global cultivation area 2023 |
~1.1M ha |
| Potential cultivation area in 2050 |
9M ha |
| If 10% of all area is used for fish feed substitution (renewable energy; S. latissima) |
0.9M × 300 = 330,000 t CO2e/yr = 0.27 Mt CO2e/yr |
| If all area used for fish feed substitution (renewable energy; L. digitata) |
0.9M × 1,230 = 1,107,000 t CO2e/yr = 1.07 Mt CO2e/yr |
Context
Adding seaweed to livestock feed could reduce agriculture’s carbon footprint by partially replacing conventional feed ingredients (like soy and corn) and/or improving feed conversion ratios so animals need less feed to reach market weight (
Costa et al., 2021;
Hofmann et al., 2025).
Studies have flagged feed conversion ratios (FCRs) as a key driver in mitigating emissions due to animal feed. The Seaweed Company has stated that their products can improve FCR by 3–10% in swine farms, reducing the carbon footprint of 100,000 pigs by up to 18,000 tons CO
2e per year (as stated in
World Bank, 2023). If applied worldwide in 2024, it could have mitigated approximately 191,003 tons CO
2e. More studies have been done replacing soy protein with seaweed for fish feed and that will be the basis for the calculations below. The global aquaculture sector generates approximately 64 Mt
CO2e per year, with feed production — particularly soy protein concentrate — representing a dominant emissions driver. Seaweed-based protein offers a partial substitution pathway for soy in fish feed.
Key Findings and Limitations of Existing Life Cycle Assessments
Multiple life cycle assessments (LCAs) have flagged energy consumption in seaweed drying and pelletizing and resourcing wild harvest versus cultivated seaweed as climate impact drivers (e.g.,
Halfdanarson et al., 2019;
Coelho et al., 2022;
Koesling et al., 2021;
Wu et al., 2025).
However, LCAs to date are incomplete in several respects. First, they do not cover the full end-to-end product lifecycle, including emissions in the cultivation process, and product end-use (
Chaurasiya et al., 2026). Second, indirect land use change may not be fully incorporated: for example, when seaweed replaces soy protein, there is less pressure to clear forests to grow soybeans, thus creating an additional mitigation benefit. Third, seaweed products are increasingly marketed as alternatives to synthetic antibiotics in livestock, but the upstream emissions from antibiotic manufacture and the downstream benefits of antibiotic reduction are absent from available LCAs, making direct like-for-like comparison impossible with regards to climate impact.
Emissions Reduction Potential
Note: The mitigation potential estimates presented here are screening-level calculations to establish order-of-magnitude plausibility under specific adoption scenarios. Each estimate is derived by combining published or estimated values for current or forecasted seaweed-based product emissions performance in currently available LCAs (e.g., methane reduction per animal, GHG intensity relative to a displaced product) with assumptions about adoption rates and addressable market size.
| Scenario |
Basis / Source |
Feasibility-adjusted (×0.75) Mt CO2e/yr |
Key condition |
| Base Case |
Koesling et al., 2021 |
0 (net climate increase: +28.8 kg CO2e/kg protein vs soy) |
Non-renewable energy |
| 2030 Scenario — renewable energy; S. latissima to L. digitata range |
Seghetta et al., 2017+ WB (2023) |
~0.009-0.035 Mt CO2e/yr |
Renewable energy is prerequisite |
| Theoretical upper bound value |
(Seghetta et al., 2017)) extrapolated to full cultivation area |
~0.27–1.07 Mt CO2e/yr |
Renewable energy; Theoretical value depicting current maximum scale |
Evidence Base
(Seghetta et al., 2017), working with Danish cultivation systems on a predominantly renewable grid, find that substituting soy with
Saccharina latissima protein reduces emissions by 300 kg
CO2e per hectare of cultivation per year; using
Laminaria digitata the emissions reduction rises to 1,230 kg
CO2e/ha/yr, reflecting that species' higher protein yield.
(
Koesling et al., 2021) however shows that under the scenario of a Norwegian grid with fossil inputs,
S. latissima protein generates
+28.8 kg CO2e per kg crude protein — a net emissions
increase versus soy. The majority of global seaweed production occurs in China, Indonesia, and the Philippines where grid electricity is substantially more carbon-intensive than Norway, meaning the (
Koesling et al., 2021) base case is closer to current reality for most global production than the
(Seghetta et al., 2017) Danish renewable scenario.
Three systematic omissions mean current figures are conservative even when conditions are met. First, indirect land-use change (iLUC): when seaweed replaces soy, reduced demand decreases pressure on land clearing in Brazil and Southeast Asia; Brazilian soy iLUC emissions are estimated at 4–12 t
CO2ee per hectare of soy displaced which is a benefit absent from current LCAs. Second, antibiotic avoidance: seaweed-based feed additives reduce synthetic antibiotic use, whose upstream production carries its own emissions footprint. Third, feed conversion ratio improvement: a 10% FCR reduction in aquaculture reduces environmental impacts by up to 24%, but this is not considered.
Calculation
| Parameter |
Value |
Note |
| Functional unit |
kg CO2e per ha cultivation area / yr (Seghetta et al., 2017) |
Per-ha basis; though Koesling et al., 2021 uses per-kg-protein basis |
| Displacement factor |
300–1,230 kg CO2e/ha/yr (S. latissima to L. digitata) |
(Seghetta et al., 2017);Danish renewable grid |
| Global seaweed cultivation area and production (2023) |
~1.1 million ha and 36 Mtons ww |
DeAngelo et al. (2023) |
| WB (2023) market volume |
$1,122M ÷ $12/kg = ~93,500 t product → ~935,000 t ww (assuming product is dried seaweed meal at 10% of ww) → ~28570 ha equiv. |
WB (2023) |
| Gross mitigation (WB central; renewable) |
28570 ha × 300–1,230 kg CO2e/ha = ~0.009–0.035 Mt CO2e/yr |
(Seghetta et al., 2017);Danish renewable grid |
A theoretical long-term anchor is total cultivation area:
| Calculation |
Value |
| Total global cultivation area 2023 |
~1.1M ha |
| Potential cultivation area in 2050 |
9M ha |
| If 10% of all area is used for fish feed substitution (renewable energy; S. latissima) |
0.9M × 300 = 330,000 t CO2e/yr = 0.27 Mt CO2e/yr |
| If all area used for fish feed substitution (renewable energy; L. digitata) |
0.9M × 1,230 = 1,107,000 t CO2e/yr = 1.07 Mt CO2e/yr |
Context
Adding seaweed to livestock feed could reduce agriculture’s carbon footprint by partially replacing conventional feed ingredients (like soy and corn) and/or improving feed conversion ratios so animals need less feed to reach market weight (
Costa et al., 2021;
Hofmann et al., 2025).
Studies have flagged feed conversion ratios (FCRs) as a key driver in mitigating emissions due to animal feed. The Seaweed Company has stated that their products can improve FCR by 3–10% in swine farms, reducing the carbon footprint of 100,000 pigs by up to 18,000 tons CO
2e per year (as stated in
World Bank, 2023). If applied worldwide in 2024, it could have mitigated approximately 191,003 tons CO
2e. More studies have been done replacing soy protein with seaweed for fish feed and that will be the basis for the calculations below. The global aquaculture sector generates approximately 64 Mt
CO2e per year, with feed production — particularly soy protein concentrate — representing a dominant emissions driver. Seaweed-based protein offers a partial substitution pathway for soy in fish feed.
Key Findings and Limitations of Existing Life Cycle Assessments
Multiple life cycle assessments (LCAs) have flagged energy consumption in seaweed drying and pelletizing and resourcing wild harvest versus cultivated seaweed as climate impact drivers (e.g.,
Halfdanarson et al., 2019;
Coelho et al., 2022;
Koesling et al., 2021;
Wu et al., 2025).
However, LCAs to date are incomplete in several respects. First, they do not cover the full end-to-end product lifecycle, including emissions in the cultivation process, and product end-use (
Chaurasiya et al., 2026). Second, indirect land use change may not be fully incorporated: for example, when seaweed replaces soy protein, there is less pressure to clear forests to grow soybeans, thus creating an additional mitigation benefit. Third, seaweed products are increasingly marketed as alternatives to synthetic antibiotics in livestock, but the upstream emissions from antibiotic manufacture and the downstream benefits of antibiotic reduction are absent from available LCAs, making direct like-for-like comparison impossible with regards to climate impact.
The estimates below are based on currently available LCAs.
Emissions Reduction Potential
| Scenario |
Basis / Source |
Feasibility-adjusted (×0.75) Mt CO2e/yr |
Key condition |
| Base Case |
Koesling et al., 2021 |
0 (net climate increase: +28.8 kg CO2e/kg protein vs soy) |
Non-renewable energy |
| 2030 Scenario — renewable energy; S. latissima to L. digitata range |
Seghetta et al., 2017+ WB (2023) |
~0.009-0.035 Mt CO2e/yr |
Renewable energy is prerequisite |
| Theoretical upper bound value |
(Seghetta et al., 2017)) extrapolated to full cultivation area |
~0.27–1.07 Mt CO2e/yr |
Renewable energy; Theoretical value depicting current maximum scale |
Evidence Base
(Seghetta et al., 2017), working with Danish cultivation systems on a predominantly renewable grid, find that substituting soy with
Saccharina latissima protein reduces emissions by 300 kg
CO2e per hectare of cultivation per year; using
Laminaria digitata the emissions reduction rises to 1,230 kg
CO2e/ha/yr, reflecting that species' higher protein yield.
(
Koesling et al., 2021) however shows that under the scenario of a Norwegian grid with fossil inputs,
S. latissima protein generates
+28.8 kg CO2e per kg crude protein — a net emissions
increase versus soy. The majority of global seaweed production occurs in China, Indonesia, and the Philippines where grid electricity is substantially more carbon-intensive than Norway, meaning the (
Koesling et al., 2021) base case is closer to current reality for most global production than the
(Seghetta et al., 2017) Danish renewable scenario.
Three systematic omissions mean current figures are conservative even when conditions are met. First, indirect land-use change (iLUC): when seaweed replaces soy, reduced demand decreases pressure on land clearing in Brazil and Southeast Asia; Brazilian soy iLUC emissions are estimated at 4–12 t
CO2ee per hectare of soy displaced which is a benefit absent from current LCAs. Second, antibiotic avoidance: seaweed-based feed additives reduce synthetic antibiotic use, whose upstream production carries its own emissions footprint. Third, feed conversion ratio improvement: a 10% FCR reduction in aquaculture reduces environmental impacts by up to 24%, but this is not considered.
Calculation
| Parameter |
Value |
Note |
| Functional unit |
kg CO2e per ha cultivation area / yr (Seghetta et al., 2017) |
Per-ha basis; though Koesling et al., 2021 uses per-kg-protein basis |
| Displacement factor |
300–1,230 kg CO2e/ha/yr (S. latissima to L. digitata) |
(Seghetta et al., 2017);Danish renewable grid |
| Global seaweed cultivation area and production (2023) |
~1.1 million ha and 36 Mtons ww |
DeAngelo et al. (2023) |
| WB (2023) market volume |
$1,122M ÷ $12/kg = ~93,500 t product → ~935,000 t ww (assuming product is dried seaweed meal at 10% of ww) → ~28570 ha equiv. |
WB (2023) |
| Gross mitigation (WB central; renewable) |
28570 ha × 300–1,230 kg CO2e/ha = ~0.009–0.035 Mt CO2e/yr |
(Seghetta et al., 2017);Danish renewable grid |
A theoretical long-term anchor is total cultivation area:
| Calculation |
Value |
| Total global cultivation area 2023 |
~1.1M ha |
| Potential cultivation area in 2050 |
9M ha |
| If 10% of all area is used for fish feed substitution (renewable energy; S. latissima) |
0.9M × 300 = 330,000 t CO2e/yr = 0.27 Mt CO2e/yr |
| If all area used for fish feed substitution (renewable energy; L. digitata) |
0.9M × 1,230 = 1,107,000 t CO2e/yr = 1.07 Mt CO2e/yr |
Context
Adding seaweed to livestock feed could reduce agriculture’s carbon footprint by partially replacing conventional feed ingredients (like soy and corn) and/or improving feed conversion ratios so animals need less feed to reach market weight (
Costa et al., 2021;
Hofmann et al., 2025).
Studies have flagged feed conversion ratios (FCRs) as a key driver in mitigating emissions due to animal feed. The Seaweed Company has stated that their products can improve FCR by 3–10% in swine farms, reducing the carbon footprint of 100,000 pigs by up to 18,000 tons CO
2e per year (as stated in
World Bank, 2023). If applied worldwide in 2024, it could have mitigated approximately 191,003 tons CO
2e. More studies have been done replacing soy protein with seaweed for fish feed and that will be the basis for the calculations below. The global aquaculture sector generates approximately 64 Mt
CO2e per year, with feed production — particularly soy protein concentrate — representing a dominant emissions driver. Seaweed-based protein offers a partial substitution pathway for soy in fish feed.
Emissions Reduction Potential
| Scenario |
Basis / Source |
Feasibility-adjusted (×0.75) Mt CO2e/yr |
Key condition |
| Base Case |
Koesling et al., 2021 |
0 (net climate increase: +28.8 kg CO2e/kg protein vs soy) |
Non-renewable energy |
| 2030 Scenario — renewable energy; S. latissima to L. digitata range |
Seghetta et al., 2017+ WB (2023) |
~0.009-0.035 Mt CO2e/yr |
Renewable energy is prerequisite |
| Theoretical upper bound value |
(Seghetta et al., 2017)) extrapolated to full cultivation area |
~0.27–1.07 Mt CO2e/yr |
Renewable energy; Theoretical value depicting current maximum scale |
Evidence Base
(Seghetta et al., 2017), working with Danish cultivation systems on a predominantly renewable grid, find that substituting soy with
Saccharina latissima protein reduces emissions by 300 kg
CO2e per hectare of cultivation per year; using
Laminaria digitata the emissions reduction rises to 1,230 kg
CO2e/ha/yr, reflecting that species' higher protein yield.
(
Koesling et al., 2021) however shows that under the scenario of a Norwegian grid with fossil inputs,
S. latissima protein generates
+28.8 kg CO2e per kg crude protein — a net emissions
increase versus soy. The majority of global seaweed production occurs in China, Indonesia, and the Philippines where grid electricity is substantially more carbon-intensive than Norway, meaning the (
Koesling et al., 2021) base case is closer to current reality for most global production than the
(Seghetta et al., 2017) Danish renewable scenario.
Three systematic omissions mean current figures are conservative even when conditions are met. First, indirect land-use change (iLUC): when seaweed replaces soy, reduced demand decreases pressure on land clearing in Brazil and Southeast Asia; Brazilian soy iLUC emissions are estimated at 4–12 t
CO2ee per hectare of soy displaced which is a benefit absent from current LCAs. Second, antibiotic avoidance: seaweed-based feed additives reduce synthetic antibiotic use, whose upstream production carries its own emissions footprint. Third, feed conversion ratio improvement: a 10% FCR reduction in aquaculture reduces environmental impacts by up to 24%, but this is not considered.
Calculation
| Parameter |
Value |
Note |
| Functional unit |
kg CO2e per ha cultivation area / yr (Seghetta et al., 2017) |
Per-ha basis; though Koesling et al., 2021 uses per-kg-protein basis |
| Displacement factor |
300–1,230 kg CO2e/ha/yr (S. latissima to L. digitata) |
(Seghetta et al., 2017);Danish renewable grid |
| Global seaweed cultivation area and production (2023) |
~1.1 million ha and 36 Mtons ww |
DeAngelo et al. (2023) |
| WB (2023) market volume |
$1,122M ÷ $12/kg = ~93,500 t product → ~935,000 t ww (assuming product is dried seaweed meal at 10% of ww) → ~28570 ha equiv. |
WB (2023) |
| Gross mitigation (WB central; renewable) |
28570 ha × 300–1,230 kg CO2e/ha = ~0.009–0.035 Mt CO2e/yr |
(Seghetta et al., 2017);Danish renewable grid |
A theoretical long-term anchor is total cultivation area:
| Calculation |
Value |
| Total global cultivation area 2023 |
~1.1M ha |
| Potential cultivation area in 2050 |
9M ha |
| If 10% of all area is used for fish feed substitution (renewable energy; S. latissima) |
0.9M × 300 = 330,000 t CO2e/yr = 0.27 Mt CO2e/yr |
| If all area used for fish feed substitution (renewable energy; L. digitata) |
0.9M × 1,230 = 1,107,000 t CO2e/yr = 1.07 Mt CO2e/yr |
Key Findings and Limitations of Existing Life Cycle Assessments
Multiple life cycle assessments (LCAs) have flagged energy consumption in seaweed drying and pelletizing and resourcing wild harvest versus cultivated seaweed as climate impact drivers (e.g.,
Halfdanarson et al., 2019;
Coelho et al., 2022;
Koesling et al., 2021;
Wu et al., 2025).
However, LCAs to date are incomplete in several respects. First, they do not cover the full end-to-end product lifecycle, including emissions in the cultivation process, and product end-use (
Chaurasiya et al., 2026). Second, indirect land use change may not be fully incorporated: for example, when seaweed replaces soy protein, there is less pressure to clear forests to grow soybeans, thus creating an additional mitigation benefit. Third, seaweed products are increasingly marketed as alternatives to synthetic antibiotics in livestock, but the upstream emissions from antibiotic manufacture and the downstream benefits of antibiotic reduction are absent from available LCAs, making direct like-for-like comparison impossible with regards to climate impact.
Context
Adding seaweed to livestock feed could reduce agriculture’s carbon footprint by partially replacing conventional feed ingredients (like soy and corn) and/or improving feed conversion ratios so animals need less feed to reach market weight (
Costa et al., 2021;
Hofmann et al., 2025).
Studies have flagged feed conversion ratios (FCRs) as a key driver in mitigating emissions due to animal feed. The Seaweed Company has stated that their products can improve FCR by 3–10% in swine farms, reducing the carbon footprint of 100,000 pigs by up to 18,000 tons CO
2e per year (as stated in
World Bank, 2023). If applied worldwide in 2024, it could have mitigated approximately 191,003 tons CO
2e. More studies have been done replacing soy protein with seaweed for fish feed and that will be the basis for the calculations below. The global aquaculture sector generates approximately 64 Mt
CO2e per year, with feed production — particularly soy protein concentrate — representing a dominant emissions driver. Seaweed-based protein offers a partial substitution pathway for soy in fish feed.
Emissions Reduction Potential
| Scenario |
Basis / Source |
Feasibility-adjusted (×0.75) Mt CO2e/yr |
Key condition |
| Base Case |
Koesling et al., 2021 |
0 (net climate increase: +28.8 kg CO2e/kg protein vs soy) |
Non-renewable energy |
| 2030 Scenario — renewable energy; S. latissima to L. digitata range |
Seghetta et al., 2017+ WB (2023) |
~0.009-0.035 Mt CO2e/yr |
Renewable energy is prerequisite |
| Long term scenario/theoretical value |
(Seghetta et al., 2017)) extrapolated to full cultivation area |
~0.27–1.07 Mt CO2e/yr |
Renewable energy; Theoretical value depicting current maximum scale |
Evidence Base
(Seghetta et al., 2017), working with Danish cultivation systems on a predominantly renewable grid, find that substituting soy with
Saccharina latissima protein reduces emissions by 300 kg
CO2e per hectare of cultivation per year; using
Laminaria digitata the emissions reduction rises to 1,230 kg
CO2e/ha/yr, reflecting that species' higher protein yield.
(
Koesling et al., 2021) however shows that under the scenario of a Norwegian grid with fossil inputs,
S. latissima protein generates
+28.8 kg CO2e per kg crude protein — a net emissions
increase versus soy. The majority of global seaweed production occurs in China, Indonesia, and the Philippines where grid electricity is substantially more carbon-intensive than Norway, meaning the (
Koesling et al., 2021) base case is closer to current reality for most global production than the
(Seghetta et al., 2017) Danish renewable scenario.
Three systematic omissions mean current figures are conservative even when conditions are met. First, indirect land-use change (iLUC): when seaweed replaces soy, reduced demand decreases pressure on land clearing in Brazil and Southeast Asia; Brazilian soy iLUC emissions are estimated at 4–12 t
CO2ee per hectare of soy displaced which is a benefit absent from current LCAs. Second, antibiotic avoidance: seaweed-based feed additives reduce synthetic antibiotic use, whose upstream production carries its own emissions footprint. Third, feed conversion ratio improvement: a 10% FCR reduction in aquaculture reduces environmental impacts by up to 24%, but this is not considered.
Calculation
| Parameter |
Value |
Note |
| Functional unit |
kg CO2e per ha cultivation area / yr (Seghetta et al., 2017) |
Per-ha basis; though Koesling et al., 2021 uses per-kg-protein basis |
| Displacement factor |
300–1,230 kg CO2e/ha/yr (S. latissima to L. digitata) |
(Seghetta et al., 2017);Danish renewable grid |
| Global seaweed cultivation area and production (2023) |
~1.1 million ha and 36 Mtons ww |
DeAngelo et al. (2023) |
| WB (2023) market volume |
$1,122M ÷ $12/kg = ~93,500 t product → ~935,000 t ww (assuming product is dried seaweed meal at 10% of ww) → ~28570 ha equiv. |
WB (2023) |
| Gross mitigation (WB central; renewable) |
28570 ha × 300–1,230 kg CO2e/ha = ~0.009–0.035 Mt CO2e/yr |
(Seghetta et al., 2017);Danish renewable grid |
A theoretical long-term anchor is total cultivation area:
| Calculation |
Value |
| Total global cultivation area 2023 |
~1.1M ha |
| Potential cultivation area in 2050 |
9M ha |
| If 10% of all area is used for fish feed substitution (renewable energy; S. latissima) |
0.9M × 300 = 330,000 t CO2e/yr = 0.27 Mt CO2e/yr |
| If all area used for fish feed substitution (renewable energy; L. digitata) |
0.9M × 1,230 = 1,107,000 t CO2e/yr = 1.07 Mt CO2e/yr |
Key Findings and Limitations of Existing Life Cycle Assessments
Multiple life cycle assessments (LCAs) have flagged energy consumption in seaweed drying and pelletizing and resourcing wild harvest versus cultivated seaweed as climate impact drivers (e.g.,
Halfdanarson et al., 2019;
Coelho et al., 2022;
Koesling et al., 2021;
Wu et al., 2025).
However, LCAs to date are incomplete in several respects. First, they do not cover the full end-to-end product lifecycle, including emissions in the cultivation process, and product end-use (
Chaurasiya et al., 2026). Second, indirect land use change may not be fully incorporated: for example, when seaweed replaces soy protein, there is less pressure to clear forests to grow soybeans, thus creating an additional mitigation benefit. Third, seaweed products are increasingly marketed as alternatives to synthetic antibiotics in livestock, but the upstream emissions from antibiotic manufacture and the downstream benefits of antibiotic reduction are absent from available LCAs, making direct like-for-like comparison impossible with regards to climate impact.
Context
Adding seaweed to livestock feed could reduce agriculture’s carbon footprint by partially replacing conventional feed ingredients (like soy and corn) and/or improving feed conversion ratios so animals need less feed to reach market weight (
Costa et al., 2021;
Hofmann et al., 2025).
Studies have flagged feed conversion ratios (FCRs) as a key driver in mitigating emissions due to animal feed. The Seaweed Company has stated that their products can improve FCR by 3–10% in swine farms, reducing the carbon footprint of 100,000 pigs by up to 18,000 tons CO
2e per year (as stated in
World Bank, 2023). If applied worldwide in 2024, it could have mitigated approximately 191,003 tons CO
2e. More studies have been done replacing soy protein with seaweed for fish feed and that will be the basis for the calculations below. The global aquaculture sector generates approximately 64 Mt
CO2e per year, with feed production — particularly soy protein concentrate — representing a dominant emissions driver. Seaweed-based protein offers a partial substitution pathway for soy in fish feed.
Emissions Reduction Potential
| Scenario |
Basis / Source |
Feasibility-adjusted (×0.75) Mt CO2e/yr |
Key condition |
| Base Case |
Koesling et al., 2021 |
0 (net climate increase: +28.8 kg CO2e/kg protein vs soy) |
Non-renewable energy |
| 2030 Scenario — renewable energy; S. latissima to L. digitata range |
Seghetta et al., 2017+ WB (2023) |
~0.009-0.035 Mt CO2e/yr |
Renewable energy is prerequisite |
| Long term/theoretical value |
(Seghetta et al., 2017)) extrapolated to full cultivation area |
~0.27–1.07 Mt CO2e/yr |
Renewable energy; Theoretical value depicting current maximum scale |
Evidence Base
(Seghetta et al., 2017), working with Danish cultivation systems on a predominantly renewable grid, find that substituting soy with
Saccharina latissima protein reduces emissions by 300 kg
CO2e per hectare of cultivation per year; using
Laminaria digitata the emissions reduction rises to 1,230 kg
CO2e/ha/yr, reflecting that species' higher protein yield.
(
Koesling et al., 2021) however shows that under the scenario of a Norwegian grid with fossil inputs,
S. latissima protein generates
+28.8 kg CO2e per kg crude protein — a net emissions
increase versus soy. The majority of global seaweed production occurs in China, Indonesia, and the Philippines where grid electricity is substantially more carbon-intensive than Norway, meaning the (
Koesling et al., 2021) base case is closer to current reality for most global production than the
(Seghetta et al., 2017) Danish renewable scenario.
Three systematic omissions mean current figures are conservative even when conditions are met. First, indirect land-use change (iLUC): when seaweed replaces soy, reduced demand decreases pressure on land clearing in Brazil and Southeast Asia; Brazilian soy iLUC emissions are estimated at 4–12 t
CO2ee per hectare of soy displaced which is a benefit absent from current LCAs. Second, antibiotic avoidance: seaweed-based feed additives reduce synthetic antibiotic use, whose upstream production carries its own emissions footprint. Third, feed conversion ratio improvement: a 10% FCR reduction in aquaculture reduces environmental impacts by up to 24%, but this is not considered.
Calculation
| Parameter |
Value |
Note |
| Functional unit |
kg CO2e per ha cultivation area / yr (Seghetta et al., 2017) |
Per-ha basis; though Koesling et al., 2021 uses per-kg-protein basis |
| Displacement factor |
300–1,230 kg CO2e/ha/yr (S. latissima to L. digitata) |
(Seghetta et al., 2017);Danish renewable grid |
| Global seaweed cultivation area and production (2023) |
~1.1 million ha and 36 Mtons ww |
DeAngelo et al. (2023) |
| WB (2023) market volume |
$1,122M ÷ $12/kg = ~93,500 t product → ~935,000 t ww (assuming product is dried seaweed meal at 10% of ww) → ~28570 ha equiv. |
WB (2023) |
| Gross mitigation (WB central; renewable) |
28570 ha × 300–1,230 kg CO2e/ha = ~0.009–0.035 Mt CO2e/yr |
(Seghetta et al., 2017);Danish renewable grid |
A theoretical long-term anchor is total cultivation area:
| Calculation |
Value |
| Total global cultivation area 2023 |
~1.1M ha |
| Potential cultivation area in 2050 |
9M ha |
| If 10% of all area is used for fish feed substitution (renewable energy; S. latissima) |
0.9M × 300 = 330,000 t CO2e/yr = 0.27 Mt CO2e/yr |
| If all area used for fish feed substitution (renewable energy; L. digitata) |
0.9M × 1,230 = 1,107,000 t CO2e/yr = 1.07 Mt CO2e/yr |
Key Findings and Limitations of Existing Life Cycle Assessments
Multiple life cycle assessments (LCAs) have flagged energy consumption in seaweed drying and pelletizing and resourcing wild harvest versus cultivated seaweed as climate impact drivers (e.g.,
Halfdanarson et al., 2019;
Coelho et al., 2022;
Koesling et al., 2021;
Wu et al., 2025).
However, LCAs to date are incomplete in several respects. First, they do not cover the full end-to-end product lifecycle, including emissions in the cultivation process, and product end-use (
Chaurasiya et al., 2026). Second, indirect land use change may not be fully incorporated: for example, when seaweed replaces soy protein, there is less pressure to clear forests to grow soybeans, thus creating an additional mitigation benefit. Third, seaweed products are increasingly marketed as alternatives to synthetic antibiotics in livestock, but the upstream emissions from antibiotic manufacture and the downstream benefits of antibiotic reduction are absent from available LCAs, making direct like-for-like comparison impossible with regards to climate impact.
Context
Adding seaweed to livestock feed could reduce agriculture’s carbon footprint by partially replacing conventional feed ingredients (like soy and corn) and/or improving feed conversion ratios so animals need less feed to reach market weight (
Costa et al., 2021;
Hofmann et al., 2025).
Studies have flagged feed conversion ratios (FCRs) as a key driver in mitigating emissions due to animal feed. The Seaweed Company has stated that their products can improve FCR by 3–10% in swine farms, reducing the carbon footprint of 100,000 pigs by up to 18,000 tons CO
2e per year (as stated in
World Bank, 2023). If applied worldwide in 2024, it could have mitigated approximately 191,003 tons CO
2e. More studies have been done replacing soy protein with seaweed for fish feed and that will be the basis for the calculations below. The global aquaculture sector generates approximately 64 Mt CO₂e per year, with feed production — particularly soy protein concentrate — representing a dominant emissions driver. Seaweed-based protein offers a partial substitution pathway for soy in fish feed.
Emissions Reduction Potential
| Scenario |
Basis / Source |
Feasibility-adjusted (×0.75) Mt CO₂e/yr |
Key condition |
| Base Case |
Koesling et al., 2021 |
0 (net climate increase: +28.8 kg CO₂e/kg protein vs soy) |
Non-renewable energy |
| 2030 Scenario — renewable energy; S. latissima to L. digitata range |
Seghetta et al., 2017+ WB (2023) |
~0.009-0.035 Mt CO₂e/yr |
Renewable energy is prerequisite |
| Long term/theoretical value |
(Seghetta et al., 2017)) extrapolated to full cultivation ara |
~0.27–1.07 Mt CO₂e/yr |
Renewable energy; Theoretical value depicting current maximum scale |
Evidence Base
(Seghetta et al., 2017), working with Danish cultivation systems on a predominantly renewable grid, find that substituting soy with
Saccharina latissima protein reduces emissions by 300 kg CO₂e per hectare of cultivation per year; using
Laminaria digitata the emissions reduction rises to 1,230 kg CO₂e/ha/yr, reflecting that species' higher protein yield.
Koesling et al. (2021) however shows that under the scenario of a Norweigian grid with fossil inputs,
S. latissima protein generates
+28.8 kg CO₂e per kg crude protein — a net emissions
increase versus soy. The majority of global seaweed production occurs in China, Indonesia, and the Philippines where grid electricity is substantially more carbon-intensive than Norway, meaning the Koesling base case is closer to current reality for most global production than the Seghetta Danish renewable scenario.
Three systematic omissions mean current figures are conservative even when conditions are met. First, indirect land-use change (iLUC): when seaweed replaces soy, reduced demand decreases pressure on land clearing in Brazil and Southeast Asia; Brazilian soy iLUC emissions are estimated at 4–12 t CO₂e per hectare of soy displaced which is a benefit absent from current LCAs. Second, antibiotic avoidance: seaweed-based feed additives reduce synthetic antibiotic use, whose upstream production carries its own emissions footprint. Third, feed conversion ratio improvement: a 10% FCR reduction in aquaculture reduces environmental impacts by up to 24%, but this is not considered.
Calculation
| Parameter |
Value |
Note |
| Functional unit |
kg CO₂e per ha cultivation area / yr (Seghetta et al., 2017) |
Per-ha basis; though Koesling et al., 2021 uses per-kg-protein basis |
| Displacement factor |
300–1,230 kg CO₂e/ha/yr (S. latissima to L. digitata) |
(Seghetta et al., 2017);Danish renewable grid |
| Global seaweed cultivation area and production (2023) |
~1.1 million ha and 36 Mtons ww |
DeAngelo et al. (2023) |
| WB (2023) market volume |
$1,122M ÷ $12/kg = ~93,500 t product → ~935,000 t ww (assuming product is dried seaweed meal at 10% of ww) → ~28570 ha equiv. |
WB (2023) |
| Gross mitigation (WB central; renewable) |
28570 ha × 300–1,230 kg CO₂e/ha = ~0.009–0.035 Mt CO₂e/yr |
(Seghetta et al., 2017);Danish renewable grid |
A theoretical long term anchor is total cultivation area:
| Calculation |
Value |
| Total global cultivation area 2023 |
~1.1M ha |
| Potential cultivation area in 2050 |
9M ha |
| If 10% of all area is used for fish feed substitution (renewable energy; S. latissima) |
0.9M × 300 = 330,000 t CO₂e/yr = 0.27 Mt CO₂e/yr |
| If all area used for fish feed substitution (renewable energy; L. digitata) |
0.9M × 1,230 = 1,107,000 t CO₂e/yr = 1.07 Mt CO₂e/yr |
Key Findings and Limitations of Existing Life Cycle Assessments
Multiple life cycle assessments (LCAs) have flagged energy consumption in seaweed drying and pelletizing and resourcing wild harvest versus cultivated seaweed as climate impact drivers (e.g.,
Halfdanarson et al., 2019;
Coelho et al., 2022;
Koesling et al., 2021;
Wu et al., 2025).
However, LCAs to date are incomplete in several respects. First, they do not cover the full end-to-end product lifecycle, including emissions in the cultivation process, and product end-use (
Chaurasiya et al., 2026). Second, indirect land use change may not be fully incorporated: for example, when seaweed replaces soy protein, there is less pressure to clear forests to grow soybeans, thus creating an additional mitigation benefit. Third, seaweed products are increasingly marketed as alternatives to synthetic antibiotics in livestock, but the upstream emissions from antibiotic manufacture and the downstream benefits of antibiotic reduction are absent from available LCAs, making direct like-for-like comparison impossible with regards to climate impact.
Context
Adding seaweed to livestock feed could reduce agriculture’s carbon footprint by partially replacing conventional feed ingredients (like soy and corn) and/or improving feed conversion ratios so animals need less feed to reach market weight (
Costa et al., 2021;
Hofmann et al., 2025).
Studies have flagged feed conversion ratios (FCRs) as a key driver in mitigating emissions due to animal feed. The Seaweed Company has stated that their products can improve FCR by 3–10% in swine farms, reducing the carbon footprint of 100,000 pigs by up to 18,000 tons CO
2e per year (as stated in
World Bank, 2023). If applied worldwide in 2024, it could have mitigated approximately 191,003 tons CO
2e. More studies have been done replacing soy protein with seaweed for fish feed and that will be the basis for the calculations below. The global aquaculture sector generates approximately 64 Mt CO₂e per year, with feed production — particularly soy protein concentrate — representing a dominant emissions driver. Seaweed-based protein offers a partial substitution pathway for soy in fish feed.
Emissions Reduction Potential
| Scenario |
Basis / Source |
Feasibility-adjusted (×0.75) Mt CO₂e/yr |
Key condition |
| Base Case |
Koesling et al., 2021 |
0 (net climate increase: +28.8 kg CO₂e/kg protein vs soy) |
Non-renewable energy |
| WB 2030 central market — renewable energy; S. latissima to L. digitata range |
Seghetta et al., 2017+ WB (2023) |
~0.009-0.035 Mt CO₂e/yr |
Renewable energy is prerequisite |
| Full 2023 cultivation area |
(Seghetta et al., 2017)) extrapolated to full cultivation ara |
~0.33–1.35 Mt CO₂e/yr |
Renewable energy; Theoretical value depicting current maximum scale |
Evidence Base
(Seghetta et al., 2017), working with Danish cultivation systems on a predominantly renewable grid, find that substituting soy with
Saccharina latissima protein reduces emissions by 300 kg CO₂e per hectare of cultivation per year; using
Laminaria digitata the emissions reduction rises to 1,230 kg CO₂e/ha/yr, reflecting that species' higher protein yield.
Koesling et al. (2021) however shows that under the scenario of a Norweigian grid with fossil inputs,
S. latissima protein generates
+28.8 kg CO₂e per kg crude protein — a net emissions
increase versus soy. The majority of global seaweed production occurs in China, Indonesia, and the Philippines where grid electricity is substantially more carbon-intensive than Norway, meaning the Koesling base case is closer to current reality for most global production than the Seghetta Danish renewable scenario.
Three systematic omissions mean current figures are conservative even when conditions are met. First, indirect land-use change (iLUC): when seaweed replaces soy, reduced demand decreases pressure on land clearing in Brazil and Southeast Asia; Brazilian soy iLUC emissions are estimated at 4–12 t CO₂e per hectare of soy displaced which is a benefit absent from current LCAs. Second, antibiotic avoidance: seaweed-based feed additives reduce synthetic antibiotic use, whose upstream production carries its own emissions footprint. Third, feed conversion ratio improvement: a 10% FCR reduction in aquaculture reduces environmental impacts by up to 24%, but this is not considered.
Calculation
| Parameter |
Value |
Note |
| Functional unit |
kg CO₂e per ha cultivation area / yr (Seghetta et al., 2017) |
Per-ha basis; though Koesling et al., 2021 uses per-kg-protein basis |
| Displacement factor |
300–1,230 kg CO₂e/ha/yr (S. latissima to L. digitata) |
(Seghetta et al., 2017);Danish renewable grid |
| Global seaweed cultivation area and production (2023) |
~1.1 million ha and 36 Mtons ww |
DeAngelo et al. (2023) |
| WB 2030 market volume |
$1,122M ÷ $12/kg = ~93,500 t product → ~935,000 t ww (assuming product is dried seaweed meal at 10% of ww) → ~28570 ha equiv. |
WB (2023) |
| Gross mitigation (WB central; renewable) |
28570 ha × 300–1,230 kg CO₂e/ha = ~0.009–0.035 Mt CO₂e/yr |
(Seghetta et al., 2017);Danish renewable grid |
The more meaningful scale anchor is total 2023 cultivation area:
| Calculation |
Value |
| Total global cultivation area 2023 |
~1.1M ha |
| If all area used for fish feed substitution (renewable energy; S. latissima) |
1.1M × 300 = 330,000 t CO₂e/yr = 0.33 Mt CO₂e/yr |
| If all area used for fish feed substitution (renewable energy; L. digitata) |
1.1M × 1,230 = 1,353,000 t CO₂e/yr = 1.35 Mt CO₂e/yr |
Key Findings and Limitations of Existing Life Cycle Assessments
Multiple life cycle assessments (LCAs) have flagged energy consumption in seaweed drying and pelletizing and resourcing wild harvest versus cultivated seaweed as climate impact drivers (e.g.,
Halfdanarson et al., 2019;
Coelho et al., 2022;
Koesling et al., 2021;
Wu et al., 2025).
However, LCAs to date are incomplete in several respects. First, they do not cover the full end-to-end product lifecycle, including emissions in the cultivation process, and product end-use (
Chaurasiya et al., 2026). Second, indirect land use change may not be fully incorporated: for example, when seaweed replaces soy protein, there is less pressure to clear forests to grow soybeans, thus creating an additional mitigation benefit. Third, seaweed products are increasingly marketed as alternatives to synthetic antibiotics in livestock, but the upstream emissions from antibiotic manufacture and the downstream benefits of antibiotic reduction are absent from available LCAs, making direct like-for-like comparison impossible with regards to climate impact.
Context
Adding seaweed to livestock feed could reduce agriculture’s carbon footprint by partially replacing conventional feed ingredients (like soy and corn) and/or improving feed conversion ratios so animals need less feed to reach market weight (
Costa et al., 2021;
Hofmann et al., 2025).
Studies have flagged feed conversion ratios (FCRs) as a key driver in mitigating emissions due to animal feed. The Seaweed Company has stated that their products can improve FCR by 3–10% in swine farms, reducing the carbon footprint of 100,000 pigs by up to 18,000 tons CO
2e per year (as stated in
World Bank, 2023). If applied worldwide in 2024, it could have mitigated approximately 191,003 tons CO
2e. More studies have been done replacing soy protein with seaweed for fish feed and that will be the basis for the calculations below. The global aquaculture sector generates approximately 64 Mt CO₂e per year, with feed production — particularly soy protein concentrate — representing a dominant emissions driver. Seaweed-based protein offers a partial substitution pathway for soy in fish feed.
Emissions Reduction Potential
| Scenario |
Basis / Source |
Feasibility-adjusted (×0.75) Mt CO₂e/yr |
Key condition |
| Base Case |
Koesling et al., 2021 |
0 (net climate increase: +28.8 kg CO₂e/kg protein vs soy) |
Non-renewable energy |
| WB 2030 central market — renewable energy; S. latissima to L. digitata range |
Seghetta et al., 2017+ WB (2023) |
~0.009-0.035 Mt CO₂e/yr |
Renewable energy is prerequisite |
| Full 2023 cultivation area |
(Seghetta et al., 2017)) extrapolated to full cultivation ara |
~0.33–1.35 Mt CO₂e/yr |
Renewable energy; Theoretical value depicting current maximum scale |
Evidence Base
(Seghetta et al., 2017), working with Danish cultivation systems on a predominantly renewable grid, find that substituting soy with
Saccharina latissima protein reduces emissions by 300 kg CO₂e per hectare of cultivation per year; using
Laminaria digitata the emissions reduction rises to 1,230 kg CO₂e/ha/yr, reflecting that species' higher protein yield.
Koesling et al. (2021) however shows that under the scenario of a Norweigian grid with fossil inputs,
S. latissima protein generates
+28.8 kg CO₂e per kg crude protein — a net emissions
increase versus soy. The majority of global seaweed production occurs in China, Indonesia, and the Philippines where grid electricity is substantially more carbon-intensive than Norway, meaning the Koesling base case is closer to current reality for most global production than the Seghetta Danish renewable scenario.
Three systematic omissions mean current figures are conservative even when conditions are met. First, indirect land-use change (iLUC): when seaweed replaces soy, reduced demand decreases pressure on land clearing in Brazil and Southeast Asia; Brazilian soy iLUC emissions are estimated at 4–12 t CO₂e per hectare of soy displaced which is a benefit absent from current LCAs. Second, antibiotic avoidance: seaweed-based feed additives reduce synthetic antibiotic use, whose upstream production carries its own emissions footprint. Third, feed conversion ratio improvement: a 10% FCR reduction in aquaculture reduces environmental impacts by up to 24%, but this is not considered.
Calculation
| Parameter |
Value |
Note |
| Functional unit |
kg CO₂e per ha cultivation area / yr (Seghetta et al., 2017) |
Per-ha basis; though Koesling et al., 2021 uses per-kg-protein basis |
| Displacement factor |
300–1,230 kg CO₂e/ha/yr (S. latissima to L. digitata) |
(Seghetta et al., 2017);Danish renewable grid |
| Global seaweed cultivation area (2023) |
~1.1 million ha |
DeAngelo et al. (2023) |
| WB 2030 market volume |
$1,122M ÷ $12/kg = ~93,500 t product → ~935,000 t ww (assuming product is dried seaweed meal at 10% of ww) → ~28570 ha equiv. |
WB (2023) |
| Gross mitigation (WB central; renewable) |
28570 ha × 300–1,230 kg CO₂e/ha = ~0.009–0.035 Mt CO₂e/yr |
(Seghetta et al., 2017);Danish renewable grid |
The more meaningful scale anchor is total 2023 cultivation area:
| Calculation |
Value |
| Total global cultivation area 2023 |
~1.1M ha |
| If all area used for fish feed substitution (renewable energy; S. latissima) |
1.1M × 300 = 330,000 t CO₂e/yr = 0.33 Mt CO₂e/yr |
| If all area used for fish feed substitution (renewable energy; L. digitata) |
1.1M × 1,230 = 1,353,000 t CO₂e/yr = 1.35 Mt CO₂e/yr |
Key Findings and Limitations of Existing Life Cycle Assessments
Multiple life cycle assessments (LCAs) have flagged energy consumption in seaweed drying and pelletizing and resourcing wild harvest versus cultivated seaweed as climate impact drivers (e.g.,
Halfdanarson et al., 2019;
Coelho et al., 2022;
Koesling et al., 2021;
Wu et al., 2025).
However, LCAs to date are incomplete in several respects. First, they do not cover the full end-to-end product lifecycle, including emissions in the cultivation process, and product end-use (
Chaurasiya et al., 2026). Second, indirect land use change may not be fully incorporated: for example, when seaweed replaces soy protein, there is less pressure to clear forests to grow soybeans, thus creating an additional mitigation benefit. Third, seaweed products are increasingly marketed as alternatives to synthetic antibiotics in livestock, but the upstream emissions from antibiotic manufacture and the downstream benefits of antibiotic reduction are absent from available LCAs, making direct like-for-like comparison impossible with regards to climate impact.
Adding seaweed to livestock feed could reduce agriculture’s carbon footprint by partially replacing conventional feed ingredients (like soy and corn) and/or improving feed conversion ratios so animals need less feed to reach market weight (
Costa et al., 2021;
Hofmann et al., 2025).
Studies have flagged feed conversion ratios (FCRs) as a key driver in mitigating emissions due to animal feed. For example, a 10% decrease in FCR in aquaculture could reduce emissions and other environmental impacts (e.g., freshwater/land use) by up to 24% (reviewed in
Teixeira-Guedes et al., 2023;
Gephart et al., 2021). The Seaweed Company has stated that their products can improve FCR by 3–10% in swine farms, reducing the carbon footprint of 100,000 pigs by up to 18,000 tons CO
2e per year (as stated in
World Bank, 2023). If applied worldwide in 2024, it could have mitigated approximately 191,003 tons CO
2e.
Seghetta et al. (2017) demonstrated that substituting soy protein with seaweed-sourced protein in fish feed can reduce 300–1,230 CO
2e kg per hectare of cultivation area, depending on the species used. If this substitution occurred at the scale of total seaweed cultivation area in 2023, it would be able to reduce over 500,000 tons CO
2e and would have required 2.7 million tons of fresh seaweed to produce. Table 4 summarizes the LCAs used and modeled mitigation potential.
| System / Product |
Net emissions change (kg CO₂e) |
Functional Unit |
Seaweed species |
Location |
System Boundary |
2023-2024 global GHG Mitigation Potential (t CO₂e) |
Annual Seaweed Production Needed & increase from 2020 global production (t wet wt) |
Reference |
| Substitution of 10% of animal feed with seaweed |
−18,000 |
100,000 swine |
— |
— |
— |
191,003 |
— |
Yıldız et al. 2021† |
| Substitution of soy with seaweed in fish feed |
-68,749 |
20,833 ha |
Saccharina latissima |
Denmark |
Cradle to factory gate |
982a |
2.7 * 106 |
Seghetta et al., 2017 |
| Substitution of soy with seaweed in fish feed |
−255,840 |
20,833 ha |
Laminaria digitata |
Denmark |
Cradle to factory gate |
3,662a |
2.7 * 106 |
Seghetta et al., 2017 |
| Substitution of Brazilian soy with seaweed in fish feed |
+28.8 |
1 kg crude protein |
Saccharina latissima |
Norway |
Cradle to factory gate |
— |
— |
Koesling et al., 2021 |
| Substitution of Brazilian soy with seaweed in animal feed – using renewable resources |
−1.1 |
1 kg crude protein |
Saccharina latissima |
Norway |
Cradle to factory gate |
520,300b |
946,000 |
Koesling et al., 2021 |
| Replacing fishmeal with 1-4% seaweed silage |
−0.05 |
1 ton of feed pellets |
Saccharina latissima |
Sweden |
Cradle to factory gate |
805c |
— |
Hempel et al., 2022 |
Table 4. Climate impact of seaweed production for animal feed. GHG mitigation potential was calculated using SW-based product CO2e emissions from Reference and the 2022-2023 global food production as reported in Our World in Data (date source: Food and Agriculture Organization of the United Nations, 2025). 2020 seaweed reference is from the FAO State of World Fisheries and Aquaculture (2024) (37.8 million tons wet weight grown in 2020). “-“ denotes when information was unavailable. a: Calculation was made with total number of hectares of land used for seaweed production as of 2023 (DeAngelo et al., 2023). b: Calculation was made using Norway soy protein concentrate imports from USDA\FAS, 2025. c: Calculation was made using 2015 global aquaculture production and wild fish used for animal fee as seen in Our World in Data. “Cradle to factory gate” denotes LCA studies that track the inputs from seaweed cultivation to product development and packaging, but before end-of-life.
Key Findings and Limitations of Existing Life Cycle Assessments
Multiple life cycle assessments (LCAs) have flagged energy consumption in seaweed drying and pelletizing and resourcing wild harvest versus cultivated seaweed as climate impact drivers (e.g.,
Halfdanarson et al., 2019;
Coelho et al., 2022;
Koesling et al., 2021;
Wu et al., 2025).
However, LCAs to date are incomplete in several respects. First, they do not cover the full end-to-end product lifecycle, including emissions in the cultivation process, and product end-use (
Chaurasiya et al., 2026). Second, indirect land use change may not be fully incorporated: for example, when seaweed replaces soy protein, there is less pressure to clear forests to grow soybeans, thus creating an additional mitigation benefit. Third, seaweed products are increasingly marketed as alternatives to synthetic antibiotics in livestock, but the upstream emissions from antibiotic manufacture and the downstream benefits of antibiotic reduction are absent from available LCAs, making direct like-for-like comparison impossible with regards to climate impact.
Adding seaweed to livestock feed could reduce agriculture’s carbon footprint by partially replacing conventional feed ingredients (like soy and corn) and/or improving feed conversion ratios so animals need less feed to reach market weight (
Costa et al., 2021;
Hofmann et al., 2025).
Studies have flagged feed conversion ratios (FCRs) as a key driver in mitigating emissions due to animal feed. For example, a 10% decrease in FCR in aquaculture could reduce emissions and other environmental impacts (e.g., freshwater/land use) by up to 24% (reviewed in
Teixeira-Guedes et al., 2023;
Gephart et al., 2021). The Seaweed Company has stated that their products can improve FCR by 3–10% in swine farms, reducing the carbon footprint of 100,000 pigs by up to 18,000 tons CO
2e per year (as stated in
World Bank, 2023). If applied worldwide in 2024, it could have mitigated approximately 191,003 tons CO
2e.
Seghetta et al. (2017) demonstrated that substituting soy protein with seaweed-sourced protein in fish feed can reduce 300–1,230 CO
2e kg per hectare of cultivation area, depending on the species used. If this substitution occurred at the scale of total seaweed cultivation area in 2023, it would be able to reduce over 500,000 tons CO
2e and would have required 2.7 million tons of fresh seaweed to produce. Table 4 summarizes the LCAs used and modeled mitigation potential.
| System / Product |
Net emissions change (kg CO₂e) |
Functional Unit |
Seaweed species |
Location |
System Boundary |
2023-2024 global GHG Mitigation Potential (t CO₂e) |
Annual Seaweed Production Needed & increase from 2020 global production (t wet wt) |
Reference |
| Substitution of 10% of animal feed with seaweed |
−18,000 |
100,000 swine |
— |
— |
— |
191,003 |
— |
Yıldız et al. 2021† |
| Substitution of soy with seaweed in fish feed |
-68,749 |
20,833 ha |
Saccharina latissima |
Denmark |
Cradle to factory gate |
982a |
2.7 * 106 |
Seghetta et al., 2017 |
| Substitution of soy with seaweed in fish feed |
−255,840 |
20,833 ha |
Laminaria digitata |
Denmark |
Cradle to factory gate |
3,662a |
2.7 * 106 |
Seghetta et al., 2017 |
| Substitution of Brazilian soy with seaweed in fish feed |
+28.8 |
1 kg crude protein |
Saccharina latissima |
Norway |
Cradle to factory gate |
— |
— |
Koesling et al., 2021 |
| Substitution of Brazilian soy with seaweed in animal feed – using renewable resources |
−1.1 |
1 kg crude protein |
Saccharina latissima |
Norway |
Cradle to factory gate |
520,300b |
946,000 |
Koesling et al., 2021 |
| Replacing fishmeal with 1-4% seaweed silage |
−0.05 |
1 ton of feed pellets |
Saccharina latissima |
Sweden |
Cradle to factory gate |
805c |
— |
Hempel et al., 2022 |
Table 4. Climate impact of seaweed production for animal feed. GHG mitigation potential was calculated using SW-based product CO2e emissions from Reference and the 2022-2023 global food production as reported in Our World in Data (date source: Food and Agriculture Organization of the United Nations, 2025). 2020 seaweed reference is from the FAO State of World Fisheries and Aquaculture (2024) (37.8 million tons wet weight grown in 2020). “-“ denotes when information was unavailable. a: Calculation was made with total number of hectares of land used for seaweed production as of 2023 (DeAngelo et al., 2023). b: Calculation was made using Norway soy protein concentrate imports from USDA\FAS, 2025. c: Calculation was made using 2015 global aquaculture production and wild fish used for animal fee as seen in Our World in Data. “Cradle to factory gate” denotes LCA studies that track the inputs from seaweed cultivation to product development and packaging, but before end-of-life.
Key Findings and Limitations of Existing Life Cycle Assessments
Multiple life cycle assessments (LCAs) have flagged energy consumption in seaweed drying and pelletizing and resourcing wild harvest versus cultivated seaweed as climate impact drivers (e.g.,
Halfdanarson et al., 2019;
Coelho et al., 2022;
Koesling et al., 2021;
Wu et al., 2025).
However, LCAs to date are incomplete in several respects. First, they do not cover the full end-to-end product lifecycle, including emissions in the cultivation process, and product end-use (
Chaurasiya et al., 2026). Second, indirect land use change may not be fully incorporated: for example, when seaweed replaces soy protein, there is less pressure to clear forests to grow soybeans, thus creating an additional mitigation benefit. Third, seaweed products are increasingly marketed as alternatives to synthetic antibiotics in livestock, but the upstream emissions from antibiotic manufacture and the downstream benefits of antibiotic reduction are absent from available LCAs, making direct like-for-like comparison impossible with regards to climate impact.
Projects from Ocean CDR Community



 Table 1. Examples of seaweed products, their species in production, and livestock that they have been used on.[/caption]
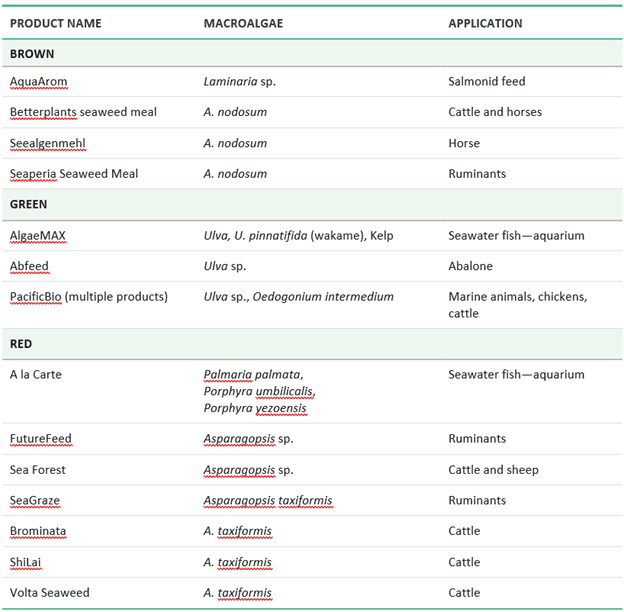 Click here for the high-resolution image.
  Click here for the high-resolution image.


 Table 2. Emering pre-/processing techniques, claimed benefits, and technological readiness/status. Sources: de Moura et al. (2008), Yuan and Macquarrie (2015), Zollmann et al. (2019), Bordoloi and Goosen (2020), Dobrinčić et al. (2020), Naseri et al. (2020), Matos et al. (2021), Sharma and Zalpouri (2022), Lewandowska et al. (2023), Choulot et al. (2025), Gaiero et al. (2025), Sumana et al. (2025)[/caption]


How to submit comments:
Thanks for helping to advance these roadmaps. Here is how it works!
Or, send general feedback to info@oceanvisions.org
All submitted comments will be reviewed by the Ocean Visions team to ensure that they are true, verifiable, and additive before being added to the road maps. You can increase the likelihood that your comments will be incorporated into the road maps by providing references (where appropriate).