State of approach
Overview
The global population is expected to reach 9 billion by 2050, and demand for increased food production carries with it the likelihood of increased greenhouse gas emissions (World Bank, 2023). Food systems contribute a quarter of global greenhouse gas emissions each year, more than 14 gigatons CO2e in 2025 (World Resources Institute, 2026). Diversifying food sources is one strategy for reducing food system emissions (World Resources Institute, 2026). Seaweed-based products are one such alternative; as a “blue food” they have the potential to generate lower emissions and environmental stressors than many terrestrially-farmed products (e.g., Gephart et al., 2021), and some species contain quantities of protein, carbohydrates, and essential amino acids that compare favorably to animal- and plant-based sources in specific respects (Garcia-Vaquero & Hayes, 2016; Cherry et al., 2019). While seaweed has been used as a dietary staple for centuries in different parts of the world (e.g., wakame, dulse, nori/gim), its use as an alternative source of protein, dietary fiber, and nutrition to conventional animal- and plant-based sources is growing (Hentati et al., 2020; Thompson, 2008).
This chapter covers the state of the science, technology, markets, and policies involved in producing seaweed-based food for human consumption. For steps in seaweed cultivation and dewatering/drying, refer to the “Cultivation and Dewatering/Drying” chapter. Seaweed typically moves from harvested biomass to a finished food product in two stages: processing and post-processing. Processing stabilizes the biomass and prepares it for safe consumption by removing impurities and improving digestibility, followed by transformation into value-added foods or ingredients. Post-processing packages the output either as a standalone seaweed food (such as nori, kombu, or seaweed “bacon”) or as an ingredient for incorporation into more processed products (such as seaweed flour, snacks, beverages).
Processing of seaweed-based foods
Processing the seaweed biomass stabilizes it, removes impurities, salts, heavy metals, and iodine; and improves digestibility (i.e., reduce polysaccharide concentration). Methods range from simple physical treatments (e.g., blanching, boiling, grinding) to more intensive chemical extractions, depending on the intended product and applicable food safety regulations.(Stévant & Rebours, 2021; Wan et al., 2019).
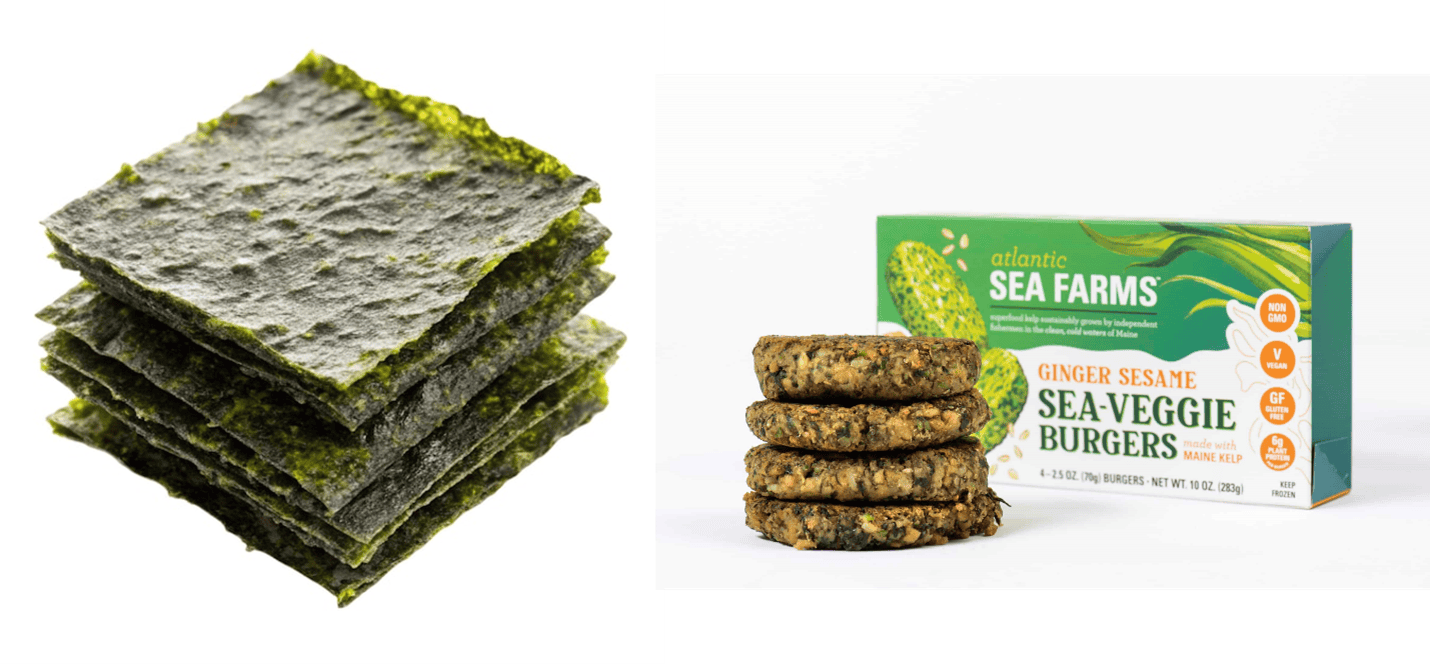
As appropriate, seaweed biomass is processed further to transform it into value-added products (e.g., noodles, flour) and/or mask any negative1 sensory traits associated with flavor and texture (Gaiero et al., 2025). The extent ranges from minimal (such as nori, kombu) to rigorous transformation (e.g., seaweed “bacon”, producing a “sea-veggie burger” from Laminaria; see Figure 1).
Processing of seaweed-based foods
Processing the seaweed biomass stabilizes it, removes impurities, salts, heavy metals, and iodine; and improves digestibility (i.e., reduce polysaccharide concentration). Methods range from simple physical treatments (e.g., blanching, boiling, grinding) to more intensive chemical extractions, depending on the intended product and applicable food safety regulations.(Stévant & Rebours, 2021; Wan et al., 2019). As appropriate, seaweed biomass is processed further to transform it into value-added products (e.g., noodles, flour) and/or mask any negative1 sensory traits associated with flavor and texture (Gaiero et al., 2025). The extent ranges from minimal (such as nori, kombu) to rigorous transformation (e.g., seaweed "bacon", producing a “sea-veggie burger” from Laminaria; see Figure 1). [caption id="attachment_12572" align="aligncenter" width="1430"] Figure 1. Nori and “sea-veggie burger” food products made with seaweed. Sources: Freepik, Atlantic Sea Farms[/caption] Processing of seaweed-based foods
Processing the seaweed biomass stabilizes it, removes impurities, salts, heavy metals, and iodine; and improves digestibility (i.e., reduce polysaccharide concentration). Methods range from simple physical treatments (e.g., blanching, boiling, grinding) to more intensive chemical extractions, depending on the intended product and applicable food safety regulations.(Stévant & Rebours, 2021; Wan et al., 2019). As appropriate, seaweed biomass is processed further to transform it into value-added products (e.g., noodles, flour) and/or mask any negative1 sensory traits associated with flavor and texture (Gaiero et al., 2025). The extent ranges from minimal (such as nori, kombu) to rigorous transformation (e.g., seaweed "bacon", producing a “sea-veggie burger” from Laminaria; see Figure 1). [caption id="attachment_12572" align="aligncenter" width="1430"] Figure 1. Nori and “sea-veggie burger” food products made with seaweed. Sources: Freepik, Atlantic Sea Farms[/caption] Processing of seaweed-based foods
Processing the seaweed biomass stabilizes it, removes impurities, salts, heavy metals, and iodine; and improves digestibility (i.e., reduce polysaccharide concentration). Methods range from simple physical treatments (e.g., blanching, boiling, grinding) to more intensive chemical extractions, depending on the intended product and applicable food safety regulations.(Stévant & Rebours, 2021; Wan et al., 2019). As appropriate, seaweed biomass is processed further to transform it into value-added products (e.g., noodles, flour) and/or mask any negative1 sensory traits associated with flavor and texture (Gaiero et al., 2025). The extent ranges from minimal (such as nori, kombu) to rigorous transformation (e.g., seaweed "bacon", producing a “sea-veggie burger” from Laminaria; see Figure 1). [caption id="attachment_12572" align="aligncenter" width="1430"] Figure 1. Nori and “sea-veggie burger” food products made with seaweed. Sources: Freepik, Atlantic Sea Farms[/caption] Processing of seaweed-based foods
Processing the seaweed biomass stabilizes it, removes impurities, salts, heavy metals, and iodine; and improves digestibility (i.e., reduce polysaccharide concentration). Methods range from simple physical treatments (e.g., blanching, boiling, grinding) to more intensive chemical extractions, depending on the intended product and applicable food safety regulations.(Stévant & Rebours, 2021; Wan et al., 2019). As appropriate, seaweed biomass is processed further to transform it into value-added products (e.g., noodles, flour) and/or mask any negative1 sensory traits associated with flavor and texture (Gaiero et al., 2025). The extent ranges from minimal (such as nori, kombu) to rigorous transformation (e.g., seaweed "bacon", producing a “sea-veggie burger” from Laminaria; see Figure 1). [caption id="attachment_12572" align="aligncenter" width="1430"] Figure 1. Nori and “sea-veggie burger” food products made with seaweed. Sources: Freepik, Atlantic Sea Farms[/caption] Processing of seaweed-based foods
Processing the seaweed biomass stabilizes it, removes impurities, salts, heavy metals, and iodine; and improves digestibility (i.e., reduce polysaccharide concentration). Methods range from simple physical treatments (e.g., blanching, boiling, grinding) to more intensive chemical extractions, depending on the intended product and applicable food safety regulations.(Stévant & Rebours, 2021; Wan et al., 2019). As appropriate, seaweed biomass is processed further to transform it into value-added products (e.g., noodles, flour) and/or mask any negative1 sensory traits associated with flavor and texture (Gaiero et al., 2025). The extent ranges from minimal (such as nori, kombu) to rigorous transformation (e.g., seaweed "bacon", producing a “sea-veggie burger” from Laminaria; see Figure 1). [caption id="attachment_12572" align="aligncenter" width="1430"] Figure 1. Nori and “sea-veggie burger” food products made with seaweed. Sources: Freepik, Atlantic Sea Farms[/caption] Processing of seaweed-based foods
Processing the seaweed biomass stabilizes it, removes impurities, salts, heavy metals, and iodine; and improves digestibility (i.e., reduce polysaccharide concentration). Methods range from simple physical treatments (e.g., blanching, boiling, grinding) to more intensive chemical extractions, depending on the intended product and applicable food safety regulations.(Stévant & Rebours, 2021; Wan et al., 2019). As appropriate, seaweed biomass is processed further to transform it into value-added products (e.g., noodles, flour) and/or mask any negative1 sensory traits associated with flavor and texture (Gaiero et al., 2025). The extent ranges from minimal (such as nori, kombu) to rigorous transformation (e.g., seaweed "bacon", producing a “sea-veggie burger” from Laminaria; see Figure 1). [caption id="attachment_12572" align="aligncenter" width="1430"] Figure 1. Nori and “sea-veggie burger” food products made with seaweed. Sources: Freepik, Atlantic Sea Farms[/caption] Processing of seaweed-based foods
Processing the seaweed biomass stabilizes it, removes impurities, salts, heavy metals, and iodine; and improves digestibility (i.e., reduce polysaccharide concentration). Methods range from simple physical treatments (e.g., blanching, boiling, grinding) to more intensive chemical extractions, depending on the intended product and applicable food safety regulations.(Stévant & Rebours, 2021; Wan et al., 2019). As appropriate, seaweed biomass is processed further to transform it into value-added products (e.g., noodles, flour) and/or mask any negative1 sensory traits associated with flavor and texture (Gaiero et al., 2025). The extent ranges from minimal (such as nori, kombu) to rigorous transformation (e.g., seaweed "bacon", producing a “sea-v eggie burger” from Laminaria; see Figure 1). [caption id="attachment_12572" align="aligncenter" width="1430"] Figure 1. Nori and “sea-veggie burger” food products made with seaweed. Sources: Freepik, Atlantic Sea Farms[/caption] Science, Technology and Engineering
This section presents an overview of the workstreams involved in producing a food product from fresh seaweed biomass. Food-specific species selection, cultivation, and harvesting activities are detailed here; for more general steps in seaweed cultivation and dewatering/drying, refer to the “Cultivation and Dewatering/Drying” chapter.
Species Selection
Of the over 10,000 species of seaweed, approximately 700 have been documented as edible (Pereira, 2016). Of these species, five species/genera dominate the seaweed food market, making up roughly 32 million tons of fresh weight produced in 2023 (FAO, 2024; Ozogul et al., 2024). Active R&D is underway to identify and mass-produce seaweed strains with improved nutritional composition, taste, and texture compared to conventional products (Ozogul et al., 2024). Table 1 summarizes seaweed groups in the global food market, and how they are used.
| Genera | Yield (Mt fresh weight) | % of World Production | Example products |
| Eucheuma | 9.4 | 29.0 | Salads Dairy products |
| Kappaphycus | 1.6 | 4.9 | Noodles Chips Flour |
| Gracilaria | 3.5 | 10.7 | Ogonori Confectionaries Dairy products |
| Porphyra/Pyropia | 2.9 | 8.9 | Nori Pasta Cookies |
| Saccharina | 11.4 | 35.3 | Kombu Stews, braises, broths |
| Undaria | 2.3 | 7.2 | Wakame Salads Soups Pasta Cheese |
| Sargassum | 0.3 | 0.8 | Hijiki Salads Stir-fry Rice dishes Pasta |
| Other non-green spp. | 0.9 | 2.8 | Carrageen pudding Bacon substitute Bread Cheese |
| Green spp. | 0.1 | 0.4 | Aonori Food supplement Tea |
Table 1. Top cultivated seaweeds in the world, as of 2020. Adapted from Chopin and Tacon (2021) and Saraswat et al. (2026).
Cultivation and harvesting
Seaweed’s nutritional and biochemical composition varies by species, location and season. Farms producing seaweed for food production use selective cultivation and harvesting practices to maximize quality, including rotational cultivation of different seaweed species throughout the year to maintain consistent supply and choosing sites that limit seaweed uptake of heavy metals, iodine, and other compounds that can be toxic to humans (Ozogul et al., 2024).
Harvest timing for food is based on peak nutritional value rather than maximum biomass. For example, although Saccharina latissima and Palmaria palmata reach peak growth in summer, they are often harvested in early spring, when protein and essential amino acid concentrations are highest (Bak et al., 2018; Stedt et al., 2022). Producers may also use post-harvest treatments to increase key nutrients before sale; for instance, soaking harvested seaweed in seafood-processing wastewater (e.g., herring tub water) can increase protein and amino acid content (Stedt et al., 2022).
Processing
Seaweed-based food products require processing to stabilize biomass during transport, reduce levels of biotoxins, and improve digestibility by breaking down cell walls. Dependent on the final product, subsequent processing steps may occur to isolate and refine target compounds into ingredients (e.g., selective compound extraction; Naseem et al., 2024) or more transformed final products (e.g., seaweed flour; Afonso et al., 2019). The steps are summarized in Figure 2; innovative technologies are described in Table 2.
Stabilization
Mechanical size reduction (e.g., chopping, milling, grinding) prepares biomass for subsequent steps. Ensiling (lactic acid fermentation) and freezing research are being conducted to extend shelf life, with the added benefit of improving flavor and digestibility (Stévant & Rebours, 2021).
Biotoxin reduction
Heat treatments using water or steam (e.g., blanching, soaking) are used to reduce levels of iodine and heavy metals to within regulatory limits, and also stabilize the seaweed for further processing (Stévant & Rebours, 2021). These steps can degrade heat-sensitive nutrients like water-soluble vitamins and minerals. Novel non-thermal alternatives (e.g. pulsed electric field and high-pressure processing) and alternative solvents (ionic liquids, subcritical water) are being studied to see if they can achieve similar safety outcomes while better preserving these compounds (Stedt et al., 2022).
Digestibility and polysaccharide extraction
Seaweed cell walls are rich in polysaccharides that reduce digestibility and limit access to proteins and other desirable compounds. Acid, alkaline, and osmotic treatments break down these walls but risk degrading product quality at high temperatures or chemical concentrations. Gentler alternatives — enzyme-assisted (EAE), ultrasound-assisted (UAE), microwave-assisted (MAE), pulsed electric field, high-pressure (HPP/PLE), and subcritical water extraction (SWE) — improve compound release more selectively while reducing heat damage and solvent use (Stedt et al., 2022; Suarez Garcia et al., 2023, Jönsson et al., 2020; Suarez Garcia et al., 2023). While these innovative methods are desirable for industry-scale use due to their specificity in targeting desirable compounds, higher yields compared to traditional methods, and lower environmental impact, each is in varying levels of technological readiness. For example, excessive temperature and microwave power for MAE can degrade heat-sensitive compounds and reduce total yield, requiring fine-scale controls (Dobrinčić et al., 2020). UAE requires specialized equipment to control ultrasound waves as well as the surface tension and viscosity of the solvent for optimal performance (Bordoloi et al., 2020). EAE will provide maximum efficiency at scale if cost-effective seaweed-specific enzymes are developed (Matos et al., 2021).
Selective compound extraction and transformation
Creating substitutes for high-carbon products like animal- and plant-based meat requires processing techniques that can isolate and purify target bioactive compounds from whole seaweed. In addition to mechanical disruption, osmotic shock, ultra-sonication, or enzymatic hydrolysis will break open cell walls/membranes to expose desirable compounds for extraction (Gaiero et al., 2025). Subsequent rounds of centrifugation will then isolate the compound from cellular debris and undissolved particles (Naseem et al., 2024). Additional processing steps, like “salting out” (ammonium sulfate precipitation) or hot/cold aqueous extraction, can be used to precipitate compounds from crude seaweed slurry (e.g., protein or agar; O’Connor et al., 2020; Naseem et al., 2024; Ozogul et al., 2024). A growing toolkit of non-thermal and “green” processing technologies is being developed to selectively access seaweed compounds desirable for food production (see Table 2) (Zollman et al., 2019; Sharma and Zalpourri, 2022; Lewandowska et al., 2023; Choulot et al., 2025).

| Innovation | Process | Claimed benefits |
| Lactic acid fermentation (ensiling) | Anaerobic fermentation with lactic acid bacteria | Better digestibility Longer shelf-life Improved nutrient profile |
| Enzyme-assisted extraction (EAE) | Soaking in enzymatic solutions under controlled heat | Better digestibility Improved nutrient extraction |
| Microwave-assisted extraction (MAE) | Uses microwaves to break cell walls and release compounds in solvent or through vapor distillation | Higher yields with less solvents Can use fresh seaweed |
| Ultrasound-assisted extraction (UAE) | High-frequency sound waves increase cell porosity for better solvent penetration and extraction | Higher yields Heat-sensitive compounds are preserved Can use fresh seaweed Less toxin bioaccumulation |
| Pulsed electric field (PEF) | Short high-voltage pulses increase cell porosity | Heat-sensitive compounds are preserved More energy-efficient |
| High-pressure processing/pressurized liquid extraction (HPP/PLE) | Extreme hydrostatic pressure ruptures cell membranes | Longer shelf-lift Higher yields Scalable for commercial application |
| Ionic liquid-assisted extraction | Ionic liquids solubilize cell matrix, releasing compounds of interest | Heat-sensitive compounds are preserved Can selectively extract compounds |
| Sub-critical water extraction (SWE) | Sub-critical temperature (100–374°C) and pressure (0.1–2.0 MPa) is used to increase extraction of compounds | Higher yields |
| Membrane filtration | Compounds are separated based on molecular weight | Non-thermal Can selectively extract compounds Recycles reagents |
| 3D printing | Builds food parts layer-by-layer using seaweed-based “inks” | Mimics textures of whole-cut animal-based products |
| Extrusion/injection molding | Builds/manipulates seaweed biopolymers/fibers to replicate animal meat fibers or value-added products | Mimics textures of whole-cut animal-based products |
Table 2. Emerging seaweed-based food pre-/processing techniques, claimed benefits, and technological readiness/status. Sources : Wan et al. (2019), Jönsson et al. (2020), Stévant and Rebours (2021), Suarez Garcia et al. (2023), Naseem et al. (2024), Ozogul et al. (2024)
Species Selection
Of the over 10,000 species of seaweed, approximately 700 have been documented as edible (Pereira, 2016). Of these species, five species/genera dominate the seaweed food market, making up roughly 32 million tons of fresh weight produced in 2023 (FAO, 2024; Ozogul et al., 2024). Active R&D is underway to identify and mass-produce seaweed strains with improved nutritional composition, taste, and texture compared to conventional products (Ozogul et al., 2024). Table 1 summarizes seaweed groups in the global food market, and how they are used.| Genera | Yield (Mt fresh weight) | % of World Production | Example products |
| Eucheuma | 9.4 | 29.0 | Salads Dairy products |
| Kappaphycus | 1.6 | 4.9 | Noodles Chips Flour |
| Gracilaria | 3.5 | 10.7 | Ogonori Confectionaries Dairy products |
| Porphyra/Pyropia | 2.9 | 8.9 | Nori Pasta Cookies |
| Saccharina | 11.4 | 35.3 | Kombu Stews, braises, broths |
| Undaria | 2.3 | 7.2 | Wakame Salads Soups Pasta Cheese |
| Sargassum | 0.3 | 0.8 | Hijiki Salads Stir-fry Rice dishes Pasta |
| Other non-green spp. | 0.9 | 2.8 | Carrageen pudding Bacon substitute Bread Cheese |
| Green spp. | 0.1 | 0.4 | Aonori Food supplement Tea |
Cultivation and harvesting
Seaweed’s nutritional and biochemical composition varies by species, location and season. Farms producing seaweed for food production use selective cultivation and harvesting practices to maximize quality, including rotational cultivation of different seaweed species throughout the year to maintain consistent supply and choosing sites that limit seaweed uptake of heavy metals, iodine, and other compounds that can be toxic to humans (Ozogul et al., 2024). Harvest timing for food is based on peak nutritional value rather than maximum biomass. For example, although Saccharina latissima and Palmaria palmata reach peak growth in summer, they are often harvested in early spring, when protein and essential amino acid concentrations are highest (Bak et al., 2018; Stedt et al., 2022). Producers may also use post-harvest treatments to increase key nutrients before sale; for instance, soaking harvested seaweed in seafood-processing wastewater (e.g., herring tub water) can increase protein and amino acid content (Stedt et al., 2022).Processing
Seaweed-based food products require processing to stabilize biomass during transport, reduce levels of biotoxins, and improve digestibility by breaking down cell walls. Dependent on the final product, subsequent processing steps may occur to isolate and refine target compounds into ingredients (e.g., selective compound extraction; Naseem et al., 2024) or more transformed final products (e.g., seaweed flour; Afonso et al., 2019). The steps are summarized in Figure 2; innovative technologies are described in Table 2.Stabilization
Mechanical size reduction (e.g., chopping, milling, grinding) prepares biomass for subsequent steps. Ensiling (lactic acid fermentation) and freezing research are being conducted to extend shelf life, with the added benefit of improving flavor and digestibility (Stévant & Rebours, 2021).Biotoxin reduction
Heat treatments using water or steam (e.g., blanching, soaking) are used to reduce levels of iodine and heavy metals to within regulatory limits, and also stabilize the seaweed for further processing (Stévant & Rebours, 2021). These steps can degrade heat-sensitive nutrients like water-soluble vitamins and minerals. Novel non-thermal alternatives (e.g. pulsed electric field and high-pressure processing) and alternative solvents (ionic liquids, subcritical water) are being studied to see if they can achieve similar safety outcomes while better preserving these compounds (Stedt et al., 2022).Digestibility and polysaccharide extraction
Seaweed cell walls are rich in polysaccharides that reduce digestibility and limit access to proteins and other desirable compounds. Acid, alkaline, and osmotic treatments break down these walls but risk degrading product quality at high temperatures or chemical concentrations. Gentler alternatives — enzyme-assisted (EAE), ultrasound-assisted (UAE), microwave-assisted (MAE), pulsed electric field, high-pressure (HPP/PLE), and subcritical water extraction (SWE) — improve compound release more selectively while reducing heat damage and solvent use (Stedt et al., 2022; Suarez Garcia et al., 2023, Jönsson et al., 2020; Suarez Garcia et al., 2023). While these innovative methods are desirable for industry-scale use due to their specificity in targeting desirable compounds, higher yields compared to traditional methods, and lower environmental impact, each is in varying levels of technological readiness. For example, excessive temperature and microwave power for MAE can degrade heat-sensitive compounds and reduce total yield, requiring fine-scale controls (Dobrinčić et al., 2020). UAE requires specialized equipment to control ultrasound waves as well as the surface tension and viscosity of the solvent for optimal performance (Bordoloi et al., 2020). EAE will provide maximum efficiency at scale if cost-effective seaweed-specific enzymes are developed (Matos et al., 2021).Selective compound extraction and transformation
Creating substitutes for high-carbon products like animal- and plant-based meat requires processing techniques that can isolate and purify target bioactive compounds from whole seaweed. In addition to mechanical disruption, osmotic shock, ultra-sonication, or enzymatic hydrolysis will break open cell walls/membranes to expose desirable compounds for extraction (Gaiero et al., 2025). Subsequent rounds of centrifugation will then isolate the compound from cellular debris and undissolved particles (Naseem et al., 2024). Additional processing steps, like “salting out” (ammonium sulfate precipitation) or hot/cold aqueous extraction, can be used to precipitate compounds from crude seaweed slurry (e.g., protein or agar; O’Connor et al., 2020; Naseem et al., 2024; Ozogul et al., 2024). A growing toolkit of non-thermal and “green” processing technologies is being developed to selectively access seaweed compounds desirable for food production (see Table 2) (Zollman et al., 2019; Sharma and Zalpourri, 2022; Lewandowska et al., 2023; Choulot et al., 2025). [caption id="attachment_12575" align="aligncenter" width="2560"] Figure 2. Flowchart of seawed-based food processing.[/caption]
| Innovation | Process | Claimed benefits |
| Lactic acid fermentation (ensiling) | Anaerobic fermentation with lactic acid bacteria | Better digestibility Longer shelf-life Improved nutrient profile |
| Enzyme-assisted extraction (EAE) | Soaking in enzymatic solutions under controlled heat | Better digestibility Improved nutrient extraction |
| Microwave-assisted extraction (MAE) | Uses microwaves to break cell walls and release compounds in solvent or through vapor distillation | Higher yields with less solvents Can use fresh seaweed |
| Ultrasound-assisted extraction (UAE) | High-frequency sound waves increase cell porosity for better solvent penetration and extraction | Higher yields Heat-sensitive compounds are preserved Can use fresh seaweed Less toxin bioaccumulation |
| Pulsed electric field (PEF) | Short high-voltage pulses increase cell porosity | Heat-sensitive compounds are preserved More energy-efficient |
| High-pressure processing/pressurized liquid extraction (HPP/PLE) | Extreme hydrostatic pressure ruptures cell membranes | Longer shelf-lift Higher yields Scalable for commercial application |
| Ionic liquid-assisted extraction | Ionic liquids solubilize cell matrix, releasing compounds of interest | Heat-sensitive compounds are preserved Can selectively extract compounds |
| Sub-critical water extraction (SWE) | Sub-critical temperature (100–374°C) and pressure (0.1–2.0 MPa) is used to increase extraction of compounds | Higher yields |
| Membrane filtration | Compounds are separated based on molecular weight | Non-thermal Can selectively extract compounds Recycles reagents |
| 3D printing | Builds food parts layer-by-layer using seaweed-based “inks” | Mimics textures of whole-cut animal-based products |
| Extrusion/injection molding | Builds/manipulates seaweed biopolymers/fibers to replicate animal meat fibers or value-added products | Mimics textures of whole-cut animal-based products |
Technology Readiness Level
Humans have consumed seaweeds for more than 15,000 years as a food/medicinal product (Corrigan et al., 2025). The following Technology Readiness Levels (TRLs) are used to assess the technological readiness of seaweed as a low-carbon food at commercial scale in the food industry, whether consumed after simple processing or transformation into a substitute for conventional animal- and plant-based food sources.
Simple processing (TRL 7–9)
- Part of daily diets around the world, conditional on regional awareness/acceptance as a food source
As substitute for animal- and plant-based food sources (TRL 5–7)
- Already in market as an additive ingredient, technology for production and integration with other ingredients are already in place
Direct human consumption (TRL 5–9)
- Part of daily diets around the world, with varying TRL levels according to the type of food product and its production at commercial-scale
As substitute for animal- and plant-based food sources (TRL 7–9)
- Already in market as a feed additive and feed ingredient, technology for production and integration with other feedstocks are already in place
Direct human consumption (TRL 9)
- Part of daily diets around the world
As substitute for animal- and plant-based food sources (TRL 7–9)
- Already in market as a feed additive and feed ingredient, technology for production and integration with other feedstocks are already in place
Direct human consumption (9)
- Part of daily diets around the world
As substitute for animal- and plant-based food sources (7–9)
- Already in market as a feed additive and feed ingredient, technology for production and integration with other feedstocks are already in place
Mitigation Potential
Context
Food systems contribute approximately 14 Gt CO2e annually (roughly a quarter of global greenhouse gas emissions) with animal protein, particularly beef, accounting for a disproportionate share. Seaweed-based foods offer a substitution pathway for high-carbon protein sources, but the climate case depends precisely on what is being displaced, with it climate advantage specific to displacement of beef and other red meat.
There are few life cycle analyses (LCAs) that directly compare seaweed-based foods to animal and plant-based substitutes; we used LCAs with the same functional unit of nutrition (e.g., protein content) to compare climate impact between different animal meat substitutes. LCAs to date are incomplete in several respects (reviewed in Waqas et al., 2024). First, they do not cover the full end-to-end product lifecycle, excluding emissions generated by transporting products to consumers and re-emissions upon product end-use through consumption and biodegradation (Eikenbusch et al., 2026). Second, there are few direct assessments of seaweed as a substitute for high-carbon food sources like animal- and plant-based protein, limiting abilities to calculate mitigation potential at scale (Eikenbusch et al., 2026). Thirdly, taxonomic and geographic data gaps exist for major farmed species of seaweed (Gephart et al., 2021; Eikenbusch et al., 2026). Finally, LCAs used below are reflective of current processes and do not take into account improvements in processing conditions.
The estimates below are based on currently available LCAs.
Emissions Reduction Potential
Note: The mitigation potential estimates presented here are screening-level calculations to establish order-of-magnitude plausibility under specific adoption scenarios. Each estimate is derived by combining published or estimated values for current or forecasted seaweed-based product emissions performance in currently available LCAs (e.g., methane reduction per animal, GHG intensity relative to a displaced product) with assumptions about adoption rates and addressable market size.
| Scenario | Basis / Source | Mitigation Potential | Key condition |
| WB 2030 central market — beef displacement | Pandey et al. (2026) + WB (2023) | ~1.72 Mt CO2e/yr | Must displace beef, not plant proteins |
| WB 2030 central — if displacing chicken instead | Pandey et al. (2026) | ~0.46 Mt CO2e/yr | Displacement factor drops ~75% |
| McDonald’s-scale illustration (2.4B burgers) | Pandey et al. (2026) | ~4.5 Mt CO2e/yr | Scale reference only — not an adoption scenario |
| DeAngelo et al. (2023) theoretical ceiling | DeAngelo et al. (2023) | 3.6–21.6 Mt CO2e/yr | Theoretical only |
Evidence Base
The key published study providing a direct protein-equivalent comparison between a seaweed product and conventional meat patties is Pandey et al. (2026), which evaluated global warming potential (GWP) per 15 g of protein across nine patty formulations. A seaweed burger patty generates approximately 0.14 kg CO2e per 15 g protein (cradle-to-retail), against 2.14 kg CO2e for a beef patty — a displacement factor of approximately 2.0 kg CO2e per 15 g protein, or roughly a 93% reduction relative to beef (Figure 3). However, the same study finds that the seaweed patty’s GWP exceeds beetroot, mussels, chickpea, and chicken patties. Another study (Eikenbusch et al., 2026) showed similarly that the GWP of seaweed-based protein sources was higher than that for plant-based sources, though the magnitude varied according to species and cultivation practice (for example, Devaleraea mollis (e.g., Pacific dulse) onshore vs. Saccharina latissimi nearshore summarized in Figure 4).The climate case is therefore compelling only where beef or other high-carbon meat is the displaced product.
A broader theoretical framing from (DeAngelo et al.,2023) modeled substitution of global average food crops with seaweed, finding 1–6 tons CO2e avoided per ton of seaweed dry weight. Applied to 2023 total production (~3.6 Mt dry weight) this yields a theoretical range of 3.6–21.6 Mt CO2e/yr — a useful scale illustration but not a projected scenario, as it assumes substitution across all food markets.
McDonald’s, a global powerhouse in burger production, sells roughly 2.4 billion burgers a year; if beef patties were substituted with seaweed at similar scale, almost 6 million tons CO2e could be mitigated each year and require nearly 9.5 million tons of fresh seaweed. Again, this is an indication of potential scale and not a near-term projection.


Figure 4. Global warming potential (kg CO₂ eq) per kg of seaweed and non-seaweed protein ingredients, ordered lowest to highest. Seaweed species Saccharina latissimi and Devaleraea mollis (Garibaldi and Bandon farms) are labeled green. D. mollis values are the average of a range of GWP. Source: Eikenbusch et al. (2026)
Calculation
| Parameter | Value | Note |
| Functional unit | kg CO2e per 15 g protein delivered (cradle-to-retail gate) | Pandey et al. (2026) |
| Seaweed patty GWP | 0.14 kg CO2e / 15 g protein | Single formulation; cradle-to-retail; Pandey et al. (2026) |
| Beef patty GWP (incumbent) | 2.14 kg CO2e / 15 g protein | Pandey et al. (2026) |
| Displacement factor | 2.0 kg CO2e / 15 g protein | Beef displacement only; falls to ~0.5 vs chicken |
| Protein per kg product | 1*(100%-10%)*20% (seaweed product at ~10% moisture, ~20% protein DW) | 15% -25% protein per dry weight of product ((Eikenbusch et al., 2026)_ |
| Protein serving per kg product | 0.18 kg/15 g protein=12 servings | Calculation |
| WB 2030 market volume | $862M ÷ $12/kg = ~71,833 t product/yr → ~861 M servings/yr | WB (2023) |
| Gross mitigation (WB central) | 861M × 2.0 kg CO2e = ~1.72 Mt CO2/yr | Beef displacement only; cradle-to-retail |
| Aggressive (McDonald’s scale) | 2.4B FUs × 2.0 kg CO2e = 4.8 Mt CO2e; × 0.75 = ~3.6 Mt CO2e/yr | Scale illustration only; not an adoption scenario |
Context
Food systems contribute approximately 14 Gt CO2e annually (roughly a quarter of global greenhouse gas emissions) with animal protein, particularly beef, accounting for a disproportionate share. Seaweed-based foods offer a substitution pathway for high-carbon protein sources, but the climate case depends precisely on what is being displaced, with it climate advantage specific to displacement of beef and other red meat. There are few life cycle analyses (LCAs) that directly compare seaweed-based foods to animal and plant-based substitutes; we used LCAs with the same functional unit of nutrition (e.g., protein content) to compare climate impact between different animal meat substitutes. LCAs to date are incomplete in several respects (reviewed in Waqas et al., 2024). First, they do not cover the full end-to-end product lifecycle, excluding emissions generated by transporting products to consumers and re-emissions upon product end-use through consumption and biodegradation (Eikenbusch et al., 2026). Second, there are few direct assessments of seaweed as a substitute for high-carbon food sources like animal- and plant-based protein, limiting abilities to calculate mitigation potential at scale (Eikenbusch et al., 2026). Thirdly, taxonomic and geographic data gaps exist for major farmed species of seaweed (Gephart et al., 2021; Eikenbusch et al., 2026). Finally, LCAs used below are reflective of current processes and do not take into account improvements in processing conditions. The estimates below are based on currently available LCAs. Emissions Reduction Potential Note: The mitigation potential estimates presented here are screening-level calculations to establish order-of-magnitude plausibility under specific adoption scenarios. Each estimate is derived by combining published or estimated values for current or forecasted seaweed-based product emissions performance in currently available LCAs (e.g., methane reduction per animal, GHG intensity relative to a displaced product) with assumptions about adoption rates and addressable market size.| Scenario | Basis / Source | Mitigation Potential | Key condition |
| WB 2030 central market — beef displacement | Pandey et al. (2026) + WB (2023) | ~1.72 Mt CO2e/yr | Must displace beef, not plant proteins |
| WB 2030 central — if displacing chicken instead | Pandey et al. (2026) | ~0.46 Mt CO2e/yr | Displacement factor drops ~75% |
| McDonald's-scale illustration (2.4B burgers) | Pandey et al. (2026) | ~4.5 Mt CO2e/yr | Scale reference only — not an adoption scenario |
| DeAngelo et al. (2023) theoretical ceiling | DeAngelo et al. (2023) | 3.6–21.6 Mt CO2e/yr | Theoretical only |
Figure 3. Global warming potential (kg CO₂ eq) per 15 g of protein for nine burger patty ingredients, ordered lowest to highest. Seaweed is in bold. Source: Pandey et al. (2026)[/caption]
| Parameter | Value | Note |
| Functional unit | kg CO2e per 15 g protein delivered (cradle-to-retail gate) | Pandey et al. (2026) |
| Seaweed patty GWP | 0.14 kg CO2e / 15 g protein | Single formulation; cradle-to-retail; Pandey et al. (2026) |
| Beef patty GWP (incumbent) | 2.14 kg CO2e / 15 g protein | Pandey et al. (2026) |
| Displacement factor | 2.0 kg CO2e / 15 g protein | Beef displacement only; falls to ~0.5 vs chicken |
| Protein per kg product | 1*(100%-10%)*20% (seaweed product at ~10% moisture, ~20% protein DW) | 15% -25% protein per dry weight of product ((Eikenbusch et al., 2026)_ |
| Protein serving per kg product | 0.18 kg/15 g protein=12 servings | Calculation |
| WB 2030 market volume | $862M ÷ $12/kg = ~71,833 t product/yr → ~861 M servings/yr | WB (2023) |
| Gross mitigation (WB central) | 861M × 2.0 kg CO2e = ~1.72 Mt CO2/yr | Beef displacement only; cradle-to-retail |
| Aggressive (McDonald's scale) | 2.4B FUs × 2.0 kg CO2e = 4.8 Mt CO2e; × 0.75 = ~3.6 Mt CO2e/yr | Scale illustration only; not an adoption scenario |
Context
Food systems contribute approximately 14 Gt CO2e annually (roughly a quarter of global greenhouse gas emissions) with animal protein, particularly beef, accounting for a disproportionate share. Seaweed-based foods offer a substitution pathway for high-carbon protein sources, but the climate case depends precisely on what is being displaced, with it climate advantage specific to displacement of beef and other red meat. There are few life cycle analyses (LCAs) that directly compare seaweed-based foods to animal and plant-based substitutes; we used LCAs with the same functional unit of nutrition (e.g., protein content) to compare climate impact between different animal meat substitutes. LCAs to date are incomplete in several respects (reviewed in Waqas et al., 2024). First, they do not cover the full end-to-end product lifecycle, excluding emissions generated by transporting products to consumers and re-emissions upon product end-use through consumption and biodegradation (Eikenbusch et al., 2026). Second, there are few direct assessments of seaweed as a substitute for high-carbon food sources like animal- and plant-based protein, limiting abilities to calculate mitigation potential at scale (Eikenbusch et al., 2026). Thirdly, taxonomic and geographic data gaps exist for major farmed species of seaweed (Gephart et al., 2021; Eikenbusch et al., 2026). Finally, LCAs used below are reflective of current processes and do not take into account improvements in processing conditions. The estimates below are based on currently available LCAs. Emissions Reduction Potential Note: The mitigation potential estimates presented here are screening-level calculations to establish order-of-magnitude plausibility under specific adoption scenarios. Each estimate is derived by combining published or estimated values for seaweed-based product emissions performance (e.g., methane reduction per animal, GHG intensity relative to a displaced product) with assumptions about adoption rates and addressable market size.| Scenario | Basis / Source | Mitigation Potential | Key condition |
| WB 2030 central market — beef displacement | Pandey et al. (2026) + WB (2023) | ~1.72 Mt CO2e/yr | Must displace beef, not plant proteins |
| WB 2030 central — if displacing chicken instead | Pandey et al. (2026) | ~0.46 Mt CO2e/yr | Displacement factor drops ~75% |
| McDonald's-scale illustration (2.4B burgers) | Pandey et al. (2026) | ~4.5 Mt CO2e/yr | Scale reference only — not an adoption scenario |
| DeAngelo et al. (2023) theoretical ceiling | DeAngelo et al. (2023) | 3.6–21.6 Mt CO2e/yr | Theoretical only |
Figure 3. Global warming potential (kg CO₂ eq) per 15 g of protein for nine burger patty ingredients, ordered lowest to highest. Seaweed is in bold. Source: Pandey et al. (2026)[/caption]
| Parameter | Value | Note |
| Functional unit | kg CO2e per 15 g protein delivered (cradle-to-retail gate) | Pandey et al. (2026) |
| Seaweed patty GWP | 0.14 kg CO2e / 15 g protein | Single formulation; cradle-to-retail; Pandey et al. (2026) |
| Beef patty GWP (incumbent) | 2.14 kg CO2e / 15 g protein | Pandey et al. (2026) |
| Displacement factor | 2.0 kg CO2e / 15 g protein | Beef displacement only; falls to ~0.5 vs chicken |
| Protein per kg product | 1*(100%-10%)*20% (seaweed product at ~10% moisture, ~20% protein DW) | 15% -25% protein per dry weight of product ((Eikenbusch et al., 2026)_ |
| Protein serving per kg product | 0.18 kg/15 g protein=12 servings | Calculation |
| WB 2030 market volume | $862M ÷ $12/kg = ~71,833 t product/yr → ~861 M servings/yr | WB (2023) |
| Gross mitigation (WB central) | 861M × 2.0 kg CO2e = ~1.72 Mt CO2/yr | Beef displacement only; cradle-to-retail |
| Aggressive (McDonald's scale) | 2.4B FUs × 2.0 kg CO2e = 4.8 Mt CO2e; × 0.75 = ~3.6 Mt CO2e/yr | Scale illustration only; not an adoption scenario |
Context
Food systems contribute approximately 14 Gt CO2e annually (roughly a quarter of global greenhouse gas emissions) with animal protein, particularly beef, accounting for a disproportionate share. Seaweed-based foods offer a substitution pathway for high-carbon protein sources, but the climate case depends precisely on what is being displaced, with it climate advantage specific to displacement of beef and other red meat. There are few life cycle analyses (LCAs) that directly compare seaweed-based foods to animal and plant-based substitutes; we used LCAs with the same functional unit of nutrition (e.g., protein content) to compare climate impact between different animal meat substitutes. LCAs to date are incomplete in several respects (reviewed in Waqas et al., 2024). First, they do not cover the full end-to-end product lifecycle, excluding emissions generated by transporting products to consumers and re-emissions upon product end-use through consumption and biodegradation (Eikenbusch et al., 2026). Second, there are few direct assessments of seaweed as a substitute for high-carbon food sources like animal- and plant-based protein, limiting abilities to calculate mitigation potential at scale (Eikenbusch et al., 2026). Thirdly, taxonomic and geographic data gaps exist for major farmed species of seaweed (Gephart et al., 2021; Eikenbusch et al., 2026). Finally, LCAs used below are reflective of current processes and do not take into account improvements in processing conditions. The estimates below are based on currently available LCAs. Emissions Reduction Potential| Scenario | Basis / Source | Mitigation Potential | Key condition |
| WB 2030 central market — beef displacement | Pandey et al. (2026) + WB (2023) | ~1.72 Mt CO2e/yr | Must displace beef, not plant proteins |
| WB 2030 central — if displacing chicken instead | Pandey et al. (2026) | ~0.46 Mt CO2e/yr | Displacement factor drops ~75% |
| McDonald's-scale illustration (2.4B burgers) | Pandey et al. (2026) | ~4.5 Mt CO2e/yr | Scale reference only — not an adoption scenario |
| DeAngelo et al. (2023) theoretical ceiling | DeAngelo et al. (2023) | 3.6–21.6 Mt CO2e/yr | Theoretical only |
Figure 3. Global warming potential (kg CO₂ eq) per 15 g of protein for nine burger patty ingredients, ordered lowest to highest. Seaweed is in bold. Source: Pandey et al. (2026)[/caption]
| Parameter | Value | Note |
| Functional unit | kg CO2e per 15 g protein delivered (cradle-to-retail gate) | Pandey et al. (2026) |
| Seaweed patty GWP | 0.14 kg CO2e / 15 g protein | Single formulation; cradle-to-retail; Pandey et al. (2026) |
| Beef patty GWP (incumbent) | 2.14 kg CO2e / 15 g protein | Pandey et al. (2026) |
| Displacement factor | 2.0 kg CO2e / 15 g protein | Beef displacement only; falls to ~0.5 vs chicken |
| Protein per kg product | 1*(100%-10%)*20% (seaweed product at ~10% moisture, ~20% protein DW) | 15% -25% protein per dry weight of product ((Eikenbusch et al., 2026)_ |
| Protein serving per kg product | 0.18 kg/15 g protein=12 servings | Calculation |
| WB 2030 market volume | $862M ÷ $12/kg = ~71,833 t product/yr → ~861 M servings/yr | WB (2023) |
| Gross mitigation (WB central) | 861M × 2.0 kg CO2e = ~1.72 Mt CO2/yr | Beef displacement only; cradle-to-retail |
| Aggressive (McDonald's scale) | 2.4B FUs × 2.0 kg CO2e = 4.8 Mt CO2e; × 0.75 = ~3.6 Mt CO2e/yr | Scale illustration only; not an adoption scenario |
Context
Food systems contribute approximately 14 Gt CO2e annually (roughly a quarter of global greenhouse gas emissions) with animal protein, particularly beef, accounting for a disproportionate share. Seaweed-based foods offer a substitution pathway for high-carbon protein sources, but the climate case depends precisely on what is being displaced, with it climate advantage specific to displacement of beef and other red meat. There are few life cycle analyses (LCAs) that directly compare seaweed-based foods to animal and plant-based substitutes; we used LCAs with the same functional unit of nutrition (e.g., protein content) to compare climate impact between different animal meat substitutes. Emissions Reduction Potential| Scenario | Basis / Source | Emissions Reduction Scenario | Key condition |
| WB 2030 central market — beef displacement | Pandey et al. (2026) + WB (2023) | ~1.72 Mt CO2e/yr | Must displace beef, not plant proteins |
| WB 2030 central — if displacing chicken instead | Pandey et al. (2026) | ~0.46 Mt CO2e/yr | Displacement factor drops ~75% |
| McDonald's-scale illustration (2.4B burgers) | Pandey et al. (2026) | ~4.5 Mt CO2e/yr | Scale reference only — not an adoption scenario |
| DeAngelo et al. (2023) theoretical ceiling | DeAngelo et al. (2023) | 3.6–21.6 Mt CO2e/yr | Theoretical only |
Figure 3. Global warming potential (kg CO₂ eq) per 15 g of protein for nine burger patty ingredients, ordered lowest to highest. Seaweed is in bold. Source: Pandey et al. (2026)[/caption]
| Parameter | Value | Note |
| Functional unit | kg CO2e per 15 g protein delivered (cradle-to-retail gate) | Pandey et al. (2026) |
| Seaweed patty GWP | 0.14 kg CO2e / 15 g protein | Single formulation; cradle-to-retail; Pandey et al. (2026) |
| Beef patty GWP (incumbent) | 2.14 kg CO2e / 15 g protein | Pandey et al. (2026) |
| Displacement factor | 2.0 kg CO2e / 15 g protein | Beef displacement only; falls to ~0.5 vs chicken |
| Protein per kg product | 1*(100%-10%)*20% (seaweed product at ~10% moisture, ~20% protein DW) | 15% -25% protein per dry weight of product ((Eikenbusch et al., 2026)_ |
| Protein serving per kg product | 0.18 kg/15 g protein=12 servings | Calculation |
| WB 2030 market volume | $862M ÷ $12/kg = ~71,833 t product/yr → ~861 M servings/yr | WB (2023) |
| Gross mitigation (WB central) | 861M × 2.0 kg CO2e = ~1.72 Mt CO2/yr | Beef displacement only; cradle-to-retail |
| Aggressive (McDonald's scale) | 2.4B FUs × 2.0 kg CO2e = 4.8 Mt CO2e; × 0.75 = ~3.6 Mt CO2e/yr | Scale illustration only; not an adoption scenario |
Limitations of Existing Life Cycle Assessments
LCAs to date are incomplete in several respects (reviewed in Waqas et al., 2024). First, they do not cover the full end-to-end product lifecycle, excluding emissions generated by transporting products to consumers and re-emissions upon product end-use through consumption and biodegradation (Eikenbusch et al., 2026). Second, there are few direct assessments of seaweed as a substitute for high-carbon food sources like animal- and plant-based protein, limiting abilities to calculate mitigation potential at scale (Eikenbusch et al., 2026). Thirdly, taxonomic and geographic data gaps exist for major farmed species of seaweed (Gephart et al., 2021; Eikenbusch et al., 2026).Context
Food systems contribute approximately 14 Gt CO₂e annually (roughly a quarter of global greenhouse gas emissions) with animal protein, particularly beef, accounting for a disproportionate share. Seaweed-based foods offer a substitution pathway for high-carbon protein sources, but the climate case depends precisely on what is being displaced, with it climate advantage specific to displacement of beef and other red meat. There are few life cycle analyses (LCAs) that directly compare seaweed-based foods to animal and plant-based substitutes; we used LCAs with the same functional unit of nutrition (e.g., protein content) to compare climate impact between different animal meat substitutes. Emissions Reduction Potential| Scenario | Basis / Source | Emissions Reduction Scenario | Key condition |
| WB 2030 central market — beef displacement | Pandey et al. (2026) + WB (2023) | ~1.72 Mt CO₂e/yr | Must displace beef, not plant proteins |
| WB 2030 central — if displacing chicken instead | Pandey et al. (2026) | ~0.46 Mt CO₂e/yr | Displacement factor drops ~75% |
| McDonald's-scale illustration (2.4B burgers) | Pandey et al. (2026) | ~4.5 Mt CO₂e/yr | Scale reference only — not an adoption scenario |
| DeAngelo et al. (2023) theoretical ceiling | DeAngelo et al. (2023) | 3.6–21.6 Mt CO₂e/yr | Theoretical only |
Figure 3. Global warming potential (kg CO₂ eq) per 15 g of protein for nine burger patty ingredients, ordered lowest to highest. Seaweed is in bold. Source: Pandey et al. (2026)[/caption]
| Parameter | Value | Note |
| Functional unit | kg CO₂e per 15 g protein delivered (cradle-to-retail gate) | Pandey et al. (2026) |
| Seaweed patty GWP | 0.14 kg CO₂e / 15 g protein | Single formulation; cradle-to-retail; Pandey et al. (2026) |
| Beef patty GWP (incumbent) | 2.14 kg CO₂e / 15 g protein | Pandey et al. (2026) |
| Displacement factor | 2.0 kg CO₂e / 15 g protein | Beef displacement only; falls to ~0.5 vs chicken |
| Protein per kg product | 1*(100%-10%)*20% (seaweed product at ~10% moisture, ~20% protein DW) | 15% -25% protein per dry weight of product ((Eikenbusch et al., 2026)_ |
| Protein serving per kg product | 0.18 kg/15 g protein=12 servings | Calculation |
| WB 2030 market volume | $862M ÷ $12/kg = ~71,833 t product/yr → ~861 M servings/yr | WB (2023) |
| Gross mitigation (WB central) | 861M × 2.0 kg CO₂e = ~1.72 Mt CO₂e/yr | Beef displacement only; cradle-to-retail |
| Aggressive (McDonald's scale) | 2.4B FUs × 2.0 kg CO₂e = 4.8 Mt CO₂e; × 0.75 = ~3.6 Mt CO₂e/yr | Scale illustration only; not an adoption scenario |
Limitations of Existing Life Cycle Assessments
LCAs to date are incomplete in several respects (reviewed in Waqas et al., 2024). First, they do not cover the full end-to-end product lifecycle, excluding emissions generated by transporting products to consumers and re-emissions upon product end-use through consumption and biodegradation (Eikenbusch et al., 2026). Second, there are few direct assessments of seaweed as a substitute for high-carbon food sources like animal- and plant-based protein, limiting abilities to calculate mitigation potential at scale (Eikenbusch et al., 2026). Thirdly, taxonomic and geographic data gaps exist for major farmed species of seaweed (Gephart et al., 2021; Eikenbusch et al., 2026).Context
Food systems contribute approximately 14 Gt CO₂e annually (roughly a quarter of global greenhouse gas emissions) with animal protein, particularly beef, accounting for a disproportionate share. Seaweed-based foods offer a substitution pathway for high-carbon protein sources, but the climate case depends precisely on what is being displaced, with it climate advantage specific to displacement of beef and other red meat. There are few life cycle analyses (LCAs) that directly compare seaweed-based foods to animal and plant-based substitutes; we used LCAs with the same functional unit of nutrition (e.g., protein content) to compare climate impact between different animal meat substitutes. Emissions Reduction Potential| Scenario | Basis / Source | Feasibility-adjusted (×0.75) Mt CO₂e/yr | Key condition |
| WB 2030 central market — beef displacement | Pandey et al. (2026) + WB (2023) | ~2.3 Mt CO₂e/yr | Must displace beef, not plant proteins |
| WB 2030 central — if displacing chicken instead | Pandey et al. (2026) | ~0.6 Mt CO₂e/yr | Displacement factor drops ~75% |
| McDonald's-scale illustration (2.4B burgers) | Pandey et al. (2026) | ~4.5 Mt CO₂e/yr | Scale reference only — not an adoption scenario |
| DeAngelo et al. (2023) theoretical ceiling | DeAngelo et al. (2023) | 3.6–21.6 Mt CO₂e/yr | Theoretical only |
| Parameter | Value | Note |
| Functional unit | kg CO₂e per 15 g protein delivered (cradle-to-retail gate) | Pandey et al. (2026) |
| Seaweed patty GWP | 0.14 kg CO₂e / 15 g protein | Single formulation; cradle-to-retail; Pandey et al. (2026) |
| Beef patty GWP (incumbent) | 2.14 kg CO₂e / 15 g protein | Pandey et al. (2026) |
| Displacement factor | 2.0 kg CO₂e / 15 g protein | Beef displacement only; falls to ~0.5 vs chicken |
| Protein units per kg product | ~14.2 food units/kg (seaweed product at ~10% moisture, ~15–25% protein DW) | Midpoint of range |
| WB 2030 market volume | $862M ÷ $12/kg = ~71,833 t product/yr → ~1.02 billion food units/yr | WB (2023) |
| Gross mitigation (WB central) | 1.02B × 2.0 kg CO₂e = ~2.04 Mt CO₂e/yr | Beef displacement only; cradle-to-retail |
| Aggressive (McDonald's scale) | 2.4B FUs × 2.0 kg CO₂e = 4.8 Mt CO₂e; × 0.75 = ~3.6 Mt CO₂e/yr | Scale illustration only; not an adoption scenario |
Limitations of Existing Life Cycle Assessments
LCAs to date are incomplete in several respects (reviewed in Waqas et al., 2024). First, they do not cover the full end-to-end product lifecycle, excluding emissions generated by transporting products to consumers and re-emissions upon product end-use through consumption and biodegradation (Eikenbusch et al., 2026). Second, there are few direct assessments of seaweed as a substitute for high-carbon food sources like animal- and plant-based protein, limiting abilities to calculate mitigation potential at scale (Eikenbusch et al., 2026). Thirdly, taxonomic and geographic data gaps exist for major farmed species of seaweed (Gephart et al., 2021; Eikenbusch et al., 2026). [caption id="attachment_12580" align="aligncenter" width="1600"] Figure 3. Global warming potential (kg CO₂ eq) per 15 g of protein for nine burger patty ingredients, ordered lowest to highest. Seaweed is in bold. Source: Pandey et al. (2026)[/caption]
[caption id="attachment_12581" align="aligncenter" width="1979"] Figure 4. Global warming potential (kg CO₂ eq) per kg of seaweed and non-seaweed protein ingredients, ordered lowest to highest. Seaweed species Saccharina latissimi and Devaleraea mollis (Garibaldi and Bandon farms) are labeled green. D. mollis values are the average of a range of GWP. Source: Eikenbusch et al. (2026)[/caption] Product Performance
Seaweed species used in food production are selected for nutritional composition as well as flavor, texture, and appearance, and can meet or exceed levels found in conventional products (e.g., Palmaria palmata and its essential amino acid profile compared to chicken eggs; Table 7) (World Bank, 2023). A critical performance threshold that the products must clear is digestibility, which not only differs by species used and processing methodology, but by the consumer (e.g., some individuals can digest seaweed more easily due to pre-existing intestinal bacteria; Sultana et al., 2023). Table 6 and Figure 5 summarize the nutritional benefits of incorporating seaweed into different food products, as well as their nutritional profiles compared to conventional food sources.
| Product (% Seaweed Inclusion) | Seaweed Used | Impacts | Change | Reference |
| Seaweed-enriched hamburger (5-40%) | Himanthalia elongata | Reduced fatty content
Retained moisture content Improved tenderness |
↑ | Cox and Abu-Ghannam, 2013 López-López et al., 2009 |
| Noodles with seaweed paste (20%) | Ulva reticulata | Improved flavor
Improved fiber content Less food after cooking Less palatability (color) |
Ns | Debbarma et al., 2017 |
| Seaweed-enriched flour (2.5, 5.0, 7.5%) | Cladophora
Ulva |
Improved protein content
Improved lipid content No difference in sensory quality No difference in technological process |
↑ | Menezes et al., 2014 |
Table 4. Examples of seaweed-based food products and their performance compared to conventional products.

| Product (% Seaweed Inclusion) | Seaweed Used | Impacts | Change | Reference |
| Seaweed-enriched hamburger (5-40%) | Himanthalia elongata | Reduced fatty content Retained moisture content Improved tenderness Reduced sodium concentration Improved fatty acid profile Improved lipoprotein metabolism | ↑ | Cox and Abu-Ghannam, 2013 López-López et al., 2009 |
| Noodles with seaweed paste (20%) | Ulva reticulata | Improved flavor Improved fiber content Less food after cooking Less palatability (color) | Ns | Debbarma et al., 2017 |
| Seaweed-enriched flour (2.5, 5.0, 7.5%) | Cladophora Ulva | Improved protein content Improved lipid content No difference in sensory quality No difference in technological process | ↑ | Menezes et al., 2014 |
Figure 5. Summary of nutrition values between seaweed and conventional food products. Values represent ranges across studies and may vary by species, season, and processing method. Seaweed is colored green (species labeled as available in the source). Sources: Naseem et al. (2024), Thiviya et al. (2022), Biris-Dorhoi et al. (2020), Vieira et al. (2018), Pandey et al. (2026), World Bank (2023), FAO (2025)[/caption] | State of the Market | USD Value (2022) in billions | USD Value (2030) in billions | Growth Rate 2022–2030 (%) |
| Global alternative proteins | 10.2 | 162.3 | 36.0 |
| Seaweed protein market | 0.536–0.558 | 976.5–977.4 | 9.8–10.5 |
| Seaweed food market | 9.9 | 12.1 | 2.3 |
Product performance
Seaweed species used in food production are selected for nutritional composition as well as flavor, texture, and appearance, and can meet or exceed levels found in conventional products (e.g., Palmaria palmata and its essential amino acid profile compared to chicken eggs; Table 7) (World Bank, 2023). A critical performance threshold that the products must clear is digestibility, which not only differs by species used and processing methodology, but by the consumer (e.g., some individuals can digest seaweed more easily due to pre-existing intestinal bacteria; Sultana et al., 2023). Table 6 and Figure 5 summarize the nutritional benefits of incorporating seaweed into different food products, as well as their nutritional profiles compared to conventional food sources.| Product (% Seaweed Inclusion) | Seaweed Used | Impacts | Change | Reference |
| Seaweed-enriched hamburger (5-40%) | Himanthalia elongata | Reduced fatty content Retained moisture content Improved tenderness Reduced sodium concentration Improved fatty acid profile Improved lipoprotein metabolism | ↑ | Cox and Abu-Ghannam, 2013 López-López et al., 2009 |
| Noodles with seaweed paste (20%) | Ulva reticulata | Improved flavor Improved fiber content Less food after cooking Less palatability (color) | Ns | Debbarma et al., 2017 |
| Seaweed-enriched flour (2.5, 5.0, 7.5%) | Cladophora Ulva | Improved protein content Improved lipid content No difference in sensory quality No difference in technological process | ↑ | Menezes et al., 2014 |
Figure 5. Summary of nutrition values between seaweed and conventional food products. Values represent ranges across studies and may vary by species, season, and processing method. Seaweed is colored green (species labeled as available in the source). Sources: Naseem et al. (2024), Thiviya et al. (2022), Biris-Dorhoi et al. (2020), Vieira et al. (2018), Pandey et al. (2026), World Bank (2023), FAO (2025)[/caption]
[caption id="attachment_12585" align="aligncenter" width="1219"] Figure 6. Prices of ingredients used in foods for human consumption. Seaweed is colored green (species labeled as available in the source); values are shaded to show ranges. Sources: World Bank (2023), Stover et al. (2024)[/caption]
 | State of the Market | USD Value (2022) in billions | USD Value (2030) in billions | Growth Rate 2022–2030 (%) |
| Global alternative proteins | 10.2 | 162.3 | 36.0 |
| Seaweed protein market | 0.536–0.558 | 976.5–977.4 | 9.8–10.5 |
| Seaweed food market | 9.9 | 12.1 | 2.3 |
Product performance
Seaweed species used in food production are selected for nutritional composition as well as flavor, texture, and appearance, and can meet or exceed levels found in conventional products (e.g., Palmaria palmata and its essential amino acid profile compared to chicken eggs; Table 7) (World Bank, 2023). A critical performance threshold that the products must clear is digestibility, which not only differs by species used and processing methodology, but by the consumer (e.g., some individuals can digest seaweed more easily due to pre-existing intestinal bacteria; Sultana et al., 2023). Table 6 and Figure 5 summarize the nutritional benefits of incorporating seaweed into different food products, as well as their nutritional profiles compared to conventional food sources.| Product (% Seaweed Inclusion) | Seaweed Used | Impacts | Change | Reference |
| Seaweed-enriched hamburger (5-40%) | Himanthalia elongata | Reduced fatty content Retained moisture content Improved tenderness Reduced sodium concentration Improved fatty acid profile Improved lipoprotein metabolism | ↑ | Cox and Abu-Ghannam, 2013 López-López et al., 2009 |
| Noodles with seaweed paste (20%) | Ulva reticulata | Improved flavor Improved fiber content Less food after cooking Less palatability (color) | Ns | Debbarma et al., 2017 |
| Seaweed-enriched flour (2.5, 5.0, 7.5%) | Cladophora Ulva | Improved protein content Improved lipid content No difference in sensory quality No difference in technological process | ↑ | Menezes et al., 2014 |
 Figure 5. Summary of nutrition values between seaweed and conventional food products. Values represent ranges across studies and may vary by species, season, and processing method. Seaweed is colored green (species labeled as available in the source). Sources: Naseem et al. (2024), Thiviya et al. (2022), Biris-Dorhoi et al. (2020), Vieira et al. (2018), Pandey et al. (2026), World Bank (2023), FAO (2025)[/caption]
[caption id="attachment_12585" align="aligncenter" width="1219"] Figure 6. Prices of ingredients used in foods for human consumption. Seaweed is colored green (species labeled as available in the source); values are shaded to show ranges. Sources: World Bank (2023), Stover et al. (2024)[/caption]
Figure 5. Summary of nutrition values between seaweed and conventional food products. Values represent ranges across studies and may vary by species, season, and processing method. Seaweed is colored green (species labeled as available in the source). Sources: Naseem et al. (2024), Thiviya et al. (2022), Biris-Dorhoi et al. (2020), Vieira et al. (2018), Pandey et al. (2026), World Bank (2023), FAO (2025)[/caption]
[caption id="attachment_12585" align="aligncenter" width="1219"] Figure 6. Prices of ingredients used in foods for human consumption. Seaweed is colored green (species labeled as available in the source); values are shaded to show ranges. Sources: World Bank (2023), Stover et al. (2024)[/caption] | State of the Market | USD Value (2022) in billions | USD Value (2030) in billions | Growth Rate 2022–2030 (%) |
| Global alternative proteins | 10.2 | 162.3 | 36.0 |
| Seaweed protein market | 0.536–0.558 | 976.5–977.4 | 9.8–10.5 |
| Seaweed food market | 9.9 | 12.1 | 2.3 |
Product performance
Seaweed species used in food production are selected for nutritional composition as well as flavor, texture, and appearance, and can meet or exceed levels found in conventional products (e.g., Palmaria palmata and its essential amino acid profile compared to chicken eggs; Table 7) (World Bank, 2023). A critical performance threshold that the products must clear is digestibility, which not only differs by species used and processing methodology, but by the consumer (e.g., some individuals can digest seaweed more easily due to pre-existing intestinal bacteria; Sultana et al., 2023). Table 6 and Figure 5 summarize the nutritional benefits of incorporating seaweed into different food products, as well as their nutritional profiles compared to conventional food sources.| Product (% Seaweed Inclusion) | Seaweed Used | Impacts | Change | Reference |
| Seaweed-enriched hamburger (5-40%) | Himanthalia elongata | Reduced fatty content Retained moisture content Improved tenderness Reduced sodium concentration Improved fatty acid profile Improved lipoprotein metabolism | ↑ | Cox and Abu-Ghannam, 2013 López-López et al., 2009 |
| Noodles with seaweed paste (20%) | Ulva reticulata | Improved flavor Improved fiber content Less food after cooking Less palatability (color) | Ns | Debbarma et al., 2017 |
| Seaweed-enriched flour (2.5, 5.0, 7.5%) | Cladophora Ulva | Improved protein content Improved lipid content No difference in sensory quality No difference in technological process | ↑ | Menezes et al., 2014 |
Figure 5. Summary of nutrition values between seaweed and conventional food products. Values represent ranges across studies and may vary by species, season, and processing method. Seaweed is colored green (species labeled as available in the source). Sources: Naseem et al. (2024), Thiviya et al. (2022), Biris-Dorhoi et al. (2020), Vieira et al. (2018), Pandey et al. (2026), World Bank (2023), FAO (2025)[/caption]
[caption id="attachment_12585" align="aligncenter" width="1219"] Figure 6. Prices of ingredients used in foods for human consumption. Seaweed is colored green (species labeled as available in the source); values are shaded to show ranges. Sources: World Bank (2023), Stover et al. (2024)[/caption] Cost/Market Adoption
| State of the Market | USD Value (2022) in billions | USD Value (2030) in billions | Growth Rate 2022–2030 (%) |
| Global alternative proteins | 10.2 | 162.3 | 36.0 |
| Seaweed protein market | 0.536–0.558 | 976.5–977.4 | 9.8–10.5 |
| Seaweed food market | 9.9 | 12.1 | 2.3 |
Table 5. State of the Market of global seaweed food and alternative protein market, included projected growth to 2030. Sources: Global Seaweed New and Emerging Markets Report (2023), Future Market Insights (2025), Grand View Research (2026a, 2026b)
| State of the Market | USD Value (2022) in billions | USD Value (2030) in billions | Growth Rate 2022–2030 (%) |
| Global alternative proteins | 10.2 | 162.3 | 36.0 |
| Seaweed protein market | 0.536–0.558 | 976.5–977.4 | 9.8–10.5 |
| Seaweed food market | 9.9 | 12.1 | 2.3 |
Figure 6. Prices of ingredients used in foods for human consumption. Seaweed is colored green (species labeled as available in the source); values are shaded to show ranges. Sources: World Bank (2023), Stover et al. (2024)[/caption] Environmental Co-benefits and Risks
Benefits
- Growing seaweed requires no arable land, high-carbon chemical fertilizers or freshwater resources Furthermore, it can be produced by recycling wastewater from other food production and processing workstreams (World Bank, 2023).
- Seaweed yields between five and eleven times as much tonnage per hectare as corn and soy, respectively reducing pressure on resources (Bellona Europa, 2017).
- If cultivating endemic/indigenous species, seaweed farms could provide bioremediation benefits to local ecosystems (Kim et al., 2015)
Risks
- Traditional industrial extraction of seaweed-based food products (e.g., alginates) can generate significant waste streams if irresponsibly managed (Ozogul et al., 2024)
Benefits
- Growing seaweed requires no arable land, high-carbon chemical fertilizers or freshwater resources Cultivating macroalgae using wastewater from food production and processing workstreams offers a low-emissions mechanism for recycling wastewater with environmental co-benefits.
- Seaweed yields between five and eleven times as much tonnage per hectare as corn and soy, respectively reducing pressure on resources (Bellona Europa, 2017).
- If cultivating endemic/indigenous species, seaweed farms could provide bioremediation benefits to local ecosystems (Kim et al., 2015)
Risks
- Traditional industrial extraction of seaweed-based food products (e.g., alginates) can generate significant waste streams if irresponsibly managed (Ozogul et al., 2024)
Community Perception
Community perception of using seaweed-based foods is variable. Communities in Asia (e.g., China, Japan, Indonesia, South Korea, Philippines) as well as a few isolated geographies in Europe (e.g., Ireland, France, Iceland, Wales) and the Americas (Nova Scotia, Maine, Hawaii) (Fleurence, 2016; Frazzini & Rossi, 2025; Mouritsen, 2013; G.-J. Wu & Hsiao, 2024) have used seaweed as a dietary staple for millennia. The seaweed foods market is growing in response to demand for natural products that promote human and animal health and plant-based food sources, but is constrained by limited familiarity and low prior experience (Roohinejad et al., 2017; Pandey et al., 2026). This lack of familiarity often leads to neophobia and a general aversion to novel foods. However, the disclosure of environmental and nutritional information significantly increases the willingness to try seaweed-based options. For example, when informed about its high iron content and low carbon footprint, consumer interest grows, as seaweed is viewed as a sustainable nutrient-booster in hybrid products (Pandey et al., 2026).
Policy and Regulation
Global seaweed regulation is currently hindered by a “standards gap” and lack of food-grade frameworks (Cottier-Cook et al., 2023). In some countries seaweed has been integrated for centuries while it is considered “novel” in others. This leads to lack of classification and standards for food quality in some regions while others mandate rigorous time-consuming safety assessments before commercialization (Good Food Institute, 2022). Countries and regions (e.g., the European Union, Canda, Singapore) are pushing seaweed-forward policies to incentivize sustainable agriculture practices and bolster food security and economic resilience (Good Food Institute, 2022; World Bank, 2023). For example, the Codex Alimentarius Commission 37th Session of the Codex Committee on Fish and Fishery Products proposed the development of two new instruments: a Code of Practice for the Production of Seaweeds and a Group Standard for Seaweed.
| Region | Policy / Regulation | Regulation Requirements | Significance and Implications |
| United States | Generally Recognized as Safe (GRAS) Notifications under FD&C Act | Scientific procedures must show that the substance is safe for consumption by an independent expert panel | Impacts seaweed species selection and conversion process |
| China | GFI 2022 | Plant-based proteins are not subject to pre-market approval requirements | Relaxed restrictions enable emerging seaweed-based food products to enter the market |
| China | National Medical Products Administration | Ingredients must be on the approved Catalogue of Raw Materials for Health Food and Nutritional Supplements; if not, full registration includes safety data, clinical/functional testing, truthful labeling, and compliance with importers and local manufacturers | Non-permissible ingredients in the final product may include specific seaweed species |
| European Union | European Food Safety Authority | Products must be intended to correct nutritional deficiencies, maintain adequate intake of certain nutrients, or support specific physiological functions | Requires clinical trials, extending the timeline to market entrance |
| Australia | Therapeutic Goods Administration (TGA); Therapeutic Goods Act 1989 | Ingredients used must be on the Permissible Ingredients Determination, undergo good manufacturing practices (GMP), meet safety/quality/efficacy standards, and be manufactured in licensed facilities | If non-permissible ingredients include a specific seaweed species, it could extend the timeline to market entrance |
Table 5. Example policies and regulations on seaweed-based food production and use.
| Region | Policy / Regulation | Regulation Requirements | Significance and Implications |
| United States | Generally Recognized as Safe (GRAS) Notifications under FD&C Act | Scientific procedures must show that the substance is safe for consumption by an independent expert panel | Impacts seaweed species selection and conversion process |
| China | GFI 2022 | Plant-based proteins are not subject to pre-market approval requirements | Relaxed restrictions enable emerging seaweed-based food products to enter the market |
| China | National Medical Products Administration | Ingredients must be on the approved Catalogue of Raw Materials for Health Food and Nutritional Supplements; if not, full registration includes safety data, clinical/functional testing, truthful labeling, and compliance with importers and local manufacturers | Non-permissible ingredients in the final product may include specific seaweed species |
| European Union | European Food Safety Authority | Products must be intended to correct nutritional deficiencies, maintain adequate intake of certain nutrients, or support specific physiological functions | Requires clinical trials, extending the timeline to market entrance |
| Australia | Therapeutic Goods Administration (TGA); Therapeutic Goods Act 1989 | Ingredients used must be on the Permissible Ingredients Determination, undergo good manufacturing practices (GMP), meet safety/quality/efficacy standards, and be manufactured in licensed facilities | If non-permissible ingredients include a specific seaweed species, it could extend the timeline to market entrance |
How to submit comments:
Thanks for helping to advance these roadmaps. Here is how it works!
Or, send general feedback to info@oceanvisions.org
All submitted comments will be reviewed by the Ocean Visions team to ensure that they are true, verifiable, and additive before being added to the road maps. You can increase the likelihood that your comments will be incorporated into the road maps by providing references (where appropriate).