Version published:
June 17, 2026 - 10:42pm
June 9, 2026 - 3:25pm
June 9, 2026 - 3:17pm
June 9, 2026 - 3:13pm
June 9, 2026 - 1:01pm
June 9, 2026 - 1:00pm
June 9, 2026 - 12:56pm
June 9, 2026 - 12:54pm
June 6, 2026 - 2:55pm
June 6, 2026 - 2:55pm
June 6, 2026 - 2:53pm
June 6, 2026 - 2:51pm
May 31, 2026 - 9:33pm
May 16, 2026 - 11:45pm
May 4, 2026 - 6:42pm
May 4, 2026 - 2:20pm
May 2, 2026 - 12:24am
April 29, 2026 - 9:08pm
April 29, 2026 - 8:54pm
April 29, 2026 - 6:46pm
April 29, 2026 - 4:49pm
April 25, 2026 - 3:58pm
March 2, 2026 - 8:48pm
Context
Livestock agriculture is responsible for approximately 7.1 Gt CO2e (2005 reference), of which enteric fermentation from ruminants accounts for 40%. Ruminant livestock (cattle, sheep, goats) produce methane (CH₄) in their rumen, which they belch into the atmosphere. Although methane persists in the atmosphere for a shorter period (around 10 years) compared to other GHGs, its global warming potential is approximately 28 times higher than that of carbon dioxide over a 100-year period (Lashof & Ahuja, 1990), making emissions reductions a high leverage priority. Without intervention, emissions from livestock supply chains are projected to rise to 9.1 Gt CO2e by 2050, driven by growing global demand for meat and dairy products (FAO, 2023).
Seaweed-derived feed additives, particularly Asparagopsis taxiformis, which accumulates the bioactive compound bromoform have demonstrated under controlled conditions the potential to reduce enteric methane emissions by 40–98% in ruminants (Kinley et al., 2020; Roque et al., 2021). This has generated significant interest because the intervention targets methane at the point of production in the rumen, rather than attempting to manage emissions downstream, and because methane is a short-lived climate pollutant where near-term reductions can deliver rapid climate benefits.
However, the cradle-to-grave lifecycle assessment shows a lower net climate benefit than the in vivo methane reduction figures suggest. Méité et al.,2024 demonstrates that a 65% reduction in enteric methane translates to a 23% reduction in whole-system GWP per liter of milk, once feed production, manure management, seaweed cultivation and transport are fully accounted for.
Screening-Level Calculation Based on Market Adoption and LCA Evidence
Note: The mitigation potential estimates presented here are screening-level calculations to establish order-of-magnitude plausibility under specific adoption scenarios. Each estimate is derived by combining published LCA values for whole-system GHG performance with assumptions about market size and adoption rates. All figures should be treated as indicative only.
Mitigation Potential (Dairy Cattle)
|
2030 |
2050 |
| Market size |
$153M |
$1,763M |
| Cost per cow per year |
$365 |
$109.50 |
| Cows supplemented |
~419,000 |
~16.1 million |
| Share of global dairy herd |
~0.16% |
~6.0% |
| Asparagopsis required (dry) |
~3,670 t/yr |
~141,000 t/yr |
| Asparagopsis required (wet) |
~30,600 t ww/yr |
~1,175,000 t ww/yr |
| Mitigation |
~0.96 Mt CO2e/yr |
~37.5 Mt CO2e/yr |
Note: We did not assess the mitigation potential for beef cattle because of the absence of an ISO-compliant LCA analysis for those systems.
Step 1 — The Evidence Base
The calculations for emissions reduction is based on Méité et al.,2024, which models Asparagopsis taxiformis supplementation in two synthetic German dairy farms supplied by a land-based Swedish production facility.
| Feature |
Detail |
| Species |
Asparagopsis taxiformis |
| Production system |
Land-based facility, Lysekil, Sweden |
| Electricity grid |
Low-carbon Swedish mix (~45 g CO2e/kWh) |
| Farm system |
Two synthetic confined German dairy farms |
| Functional unit |
1 kg fat- and protein-corrected milk |
| |
|
Note: Thomas et al. (2025), the most comprehensive multi-species LCA available, tested Asparagopsis taxiformis (AT) in a dairy scenario but using pilot-scale freeze-drying and harvesting by scuba divers. Their AT dairy scenario produced worse outcomes than baseline. The industry is moving toward oil-based formulations that avoid freeze-drying, but no LCA yet exists for this route. Méité et al.,2024 was chosen here because it attempts to evaluate complementary mitigation strategies (e.g. nutritional adjustments, manure management) and optimization in upstream processing such as drying.
Step 2 — Displacement Factor: Change in Emissions Intensity vs. Baseline
| Scenario |
Emissions Intensity (kg CO2e/L milk) |
vs Baseline |
| No supplement (baseline) |
1.014 |
— |
| Low dose — 0.5% OM/day |
0.914 |
-10% |
| High dose — 1% OM/day |
0.781 |
-23% |
| Displacement |
0.233 |
|
Step 3 — Cost Assumptions
The supplement cost figures are drawn from the World Bank Global Seaweed: New and Emerging Markets Report (2023) and relate to the cost of feeding Asparagopsis-based supplements to beef cattle. Note: These are applied here to dairy cattle as the best available published cost estimate; no equivalent published cost figure exists specifically for dairy supplementation.
The decline from $1.00 to $0.30/day reflects anticipated cost reductions as Asparagopsis production scales and processing technology matures.
Step 4 —Market Size and Herd Coverage
Note: 13% was the median growth rate of ocean industries (including offshore wind, offshore oil and gas, seaborne trade, aquaculture) during their scale up period
Step 5- Mitigation
| Parameter |
2030 |
2050 |
Source |
| Cows supplemented |
~419,000 |
~16.1 million |
Above |
| Milk per cow per year |
10,000 L |
10,000 L |
AHDB (Using US as the example) |
| Displacement per liter |
0.233 kg CO2e/L |
0.233 kg CO2e/L |
Step 2 |
| Gross mitigation |
~0.96 Mt CO₂e/yr |
~37.5 Mt CO2e/yr |
Derived (Cows supplemented*Displacement per liter * Milk per cow per year) |
| As % of global dairy emissions (~2.9 Gt) |
~0.024% |
~0.9% |
Derived |
Asparagopsis supply required
| Parameter |
2030 |
2050 |
Source |
| Daily DM intake per cow |
20 kg DM/day |
20 kg DM/day |
Standard dairy nutrition |
| OM content of DM |
95% |
95% |
Standard |
| Inclusion rate (high dose) |
1% of OM/day |
1% of OM/day |
Méité et al.,(2024) |
| Daily Asparagopsis dry weight per cow |
~0.024 kg/day |
~0.024 kg/day |
Derived |
| Annual dry weight per cow |
~8.76 kg/yr |
~8.76 kg/yr |
0.024 × 365 |
| Total dry weight required |
~3,670 t dry/yr |
~141,000 t dry/yr |
Cows × 8.76 ÷ 10⁶ |
Key Assumptions
| Assumption |
Value used |
Uncertainty |
| Displacement factor |
0.233 kg CO2e/L |
High-dose optimized scenario only; requires low-carbon grid and full herd supplementation; falls to 0.093 kg CO2e/L at low dose |
| Supplement cost 2030 |
$1.00/cow/day ($365/yr) |
World Bank (2023) beef cattle cost applied to dairy; may differ for dairy systems |
| Supplement cost 2050 |
$0.30/cow/day ($109.50/yr) |
Assumes cost reduction with scale and shift to oil-based formulation |
| Cost basis |
Beef cattle costs applied to dairy |
No equivalent published dairy-specific cost figure |
| 13% CAGR |
11.52× market multiplier |
Higher than general seaweed market growth (~8% CAGR); assumes sustained commercial momentum |
| Addressable market |
Confined dairy systems only |
~70% of global enteric methane from pasture systems with no current delivery mechanism |
| Processing route |
Low-energy drying assumed |
Commercial trajectory toward oil-based formulation; |
| Bromoform atmospheric fate |
Not included |
Potential ozone depletion contribution still unquantified |
| Mitigation for beef feedlots and pasture systems |
Not included |
Need better LCAs (beef systems) and implementation plan in pasture systems |
|
|
|
Context
Livestock agriculture is responsible for approximately
7.1 Gt CO2e (2005 reference), of which enteric fermentation from ruminants accounts for 40%. Ruminant livestock (cattle, sheep, goats) produce methane (CH₄) in their rumen, which they belch into the atmosphere. Although methane persists in the atmosphere for a shorter period (around 10 years) compared to other GHGs, its global warming potential is approximately 28 times higher than that of carbon dioxide over a 100-year period (
Lashof & Ahuja, 1990), making emissions reductions a high leverage priority. Without intervention, emissions from livestock supply chains are projected to rise to 9.1 Gt
CO2e by 2050, driven by growing global demand for meat and dairy products (
FAO, 2023).
Seaweed-derived feed additives, particularly
Asparagopsis taxiformis, which accumulates the bioactive compound bromoform have demonstrated under controlled conditions the potential to reduce enteric methane emissions by 40–98% in ruminants (
Kinley et al., 2020;
Roque et al., 2021). This has generated significant interest because the intervention targets methane at the point of production in the rumen, rather than attempting to manage emissions downstream, and because methane is a short-lived climate pollutant where near-term reductions can deliver rapid climate benefits.
However, the cradle-to-grave lifecycle assessment shows a lower net climate benefit than the in vivo methane reduction figures suggest.
Méité et al.,2024 demonstrates that a 65% reduction in enteric methane translates to a 23% reduction in whole-system GWP per liter of milk, once feed production, manure management, seaweed cultivation and transport are fully accounted for.
Screening-Level Calculation Based on Market Adoption and LCA Evidence
Note: The mitigation potential estimates presented here are screening-level calculations to establish order-of-magnitude plausibility under specific adoption scenarios. Each estimate is derived by combining published LCA values for whole-system GHG performance with assumptions about market size and adoption rates. All figures should be treated as indicative only.
Mitigation Potential (Dairy Cattle)
|
2030 |
2050 |
| Market size |
$153M |
$1,763M |
| Cost per cow per year |
$365 |
$109.50 |
| Cows supplemented |
~419,000 |
~16.1 million |
| Share of global dairy herd |
~0.16% |
~6.0% |
| Asparagopsis required (dry) |
~3,670 t/yr |
~141,000 t/yr |
| Asparagopsis required (wet) |
~30,600 t ww/yr |
~1,175,000 t ww/yr |
| Mitigation |
~0.96 Mt CO2e/yr |
~37.5 Mt CO2e/yr |
Note: We did not assess the mitigation potential for beef cattle because of the absence of an ISO-compliant LCA analysis for those systems.
Step 1 — The Evidence Base
The calculations for emissions reduction is based on
Méité et al.,2024, which models
Asparagopsis taxiformis supplementation in two synthetic German dairy farms supplied by a land-based Swedish production facility.
| Feature |
Detail |
| Species |
Asparagopsis taxiformis |
| Production system |
Land-based facility, Lysekil, Sweden |
| Electricity grid |
Low-carbon Swedish mix (~45 g CO2e/kWh) |
| Farm system |
Two synthetic confined German dairy farms |
| Functional unit |
1 kg fat- and protein-corrected milk |
| |
|
Note:
Thomas et al. (2025), the most comprehensive multi-species LCA available, tested
Asparagopsis taxiformis (AT) in a dairy scenario but using pilot-scale freeze-drying and harvesting by scuba divers. Their AT dairy scenario produced worse outcomes than baseline. The industry is moving toward oil-based formulations that avoid freeze-drying, but no LCA yet exists for this route.
Méité et al.,2024 was chosen here because it attempts to evaluate complementary mitigation strategies (e.g. nutritional adjustments, manure management) and optimization in upstream processing such as drying.
Step 2 — Displacement Factor: Change in Emissions Intensity vs. Baseline
| Scenario |
Emissions Intensity (kg CO2e/L milk) |
vs Baseline |
| No supplement (baseline) |
1.014 |
— |
| Low dose — 0.5% OM/day |
0.914 |
-10% |
| High dose — 1% OM/day |
0.781 |
-23% |
| Displacement |
0.233 |
|
Step 3 — Cost Assumptions
The supplement cost figures are drawn from the
World Bank Global Seaweed: New and Emerging Markets Report (2023) and relate to the cost of feeding
Asparagopsis-based supplements to beef cattle. Note: These are applied here to dairy cattle as the best available published cost estimate; no equivalent published cost figure exists specifically for dairy supplementation.
The decline from $1.00 to $0.30/day reflects anticipated cost reductions as
Asparagopsis production scales and processing technology matures.
Step 4 —Market Size and Herd Coverage
Note: 13% was the median growth rate of ocean industries (including offshore wind, offshore oil and gas, seaborne trade, aquaculture) during their scale up period
Step 5- Mitigation:
| Parameter |
2030 |
2050 |
Source |
| Cows supplemented |
~419,000 |
~16.1 million |
Above |
| Milk per cow per year |
10,000 L |
10,000 L |
AHDB (Using US as the example) |
| Displacement per liter |
0.233 kg CO2e/L |
0.233 kg CO2e/L |
Step 2 |
| Gross mitigation |
~0.96 Mt CO₂e/yr |
~37.5 Mt CO2e/yr |
Derived (Cows supplemented*Displacement per liter * Milk per cow per year) |
| As % of global dairy emissions (~2.9 Gt) |
~0.024% |
~0.9% |
Derived |
Asparagopsis supply required:
| Parameter |
2030 |
2050 |
Source |
| Daily DM intake per cow |
20 kg DM/day |
20 kg DM/day |
Standard dairy nutrition |
| OM content of DM |
95% |
95% |
Standard |
| Inclusion rate (high dose) |
1% of OM/day |
1% of OM/day |
Méité et al.,(2024) |
| Daily Asparagopsis dry weight per cow |
~0.024 kg/day |
~0.024 kg/day |
Derived |
| Annual dry weight per cow |
~8.76 kg/yr |
~8.76 kg/yr |
0.024 × 365 |
| Total dry weight required |
~3,670 t dry/yr |
~141,000 t dry/yr |
Cows × 8.76 ÷ 10⁶ |
Key Assumptions
| Assumption |
Value used |
Uncertainty |
| Displacement factor |
0.233 kg CO2e/L |
High-dose optimized scenario only; requires low-carbon grid and full herd supplementation; falls to 0.093 kg CO2e/L at low dose |
| Supplement cost 2030 |
$1.00/cow/day ($365/yr) |
World Bank (2023) beef cattle cost applied to dairy; may differ for dairy systems |
| Supplement cost 2050 |
$0.30/cow/day ($109.50/yr) |
Assumes cost reduction with scale and shift to oil-based formulation |
| Cost basis |
Beef cattle costs applied to dairy |
No equivalent published dairy-specific cost figure |
| 13% CAGR |
11.52× market multiplier |
Higher than general seaweed market growth (~8% CAGR); assumes sustained commercial momentum |
| Addressable market |
Confined dairy systems only |
~70% of global enteric methane from pasture systems with no current delivery mechanism |
| Processing route |
Low-energy drying assumed |
Commercial trajectory toward oil-based formulation; |
| Bromoform atmospheric fate |
Not included |
Potential ozone depletion contribution still unquantified |
| Mitigation for beef feedlots and pasture systems |
Not included |
Need better LCAs (beef systems) and implementation plan in pasture systems |
|
|
|
Context
Livestock agriculture is responsible for approximately
7.1 Gt CO2e (2005 reference), of which enteric fermentation from ruminants accounts for 40%. Ruminant livestock (cattle, sheep, goats) produce methane (CH₄) in their rumen, which they belch into the atmosphere. Although methane persists in the atmosphere for a shorter period (around 10 years) compared to other GHGs, its global warming potential is approximately 28 times higher than that of carbon dioxide over a 100-year period (
Lashof & Ahuja, 1990), making emissions reductions a high leverage priority. Without intervention, emissions from livestock supply chains are projected to rise to 9.1 Gt
CO2e by 2050, driven by growing global demand for meat and dairy products (
FAO, 2023).
Seaweed-derived feed additives, particularly
Asparagopsis taxiformis, which accumulates the bioactive compound bromoform have demonstrated under controlled conditions the potential to reduce enteric methane emissions by 40–98% in ruminants (
Kinley et al., 2020;
Roque et al., 2021). This has generated significant interest because the intervention targets methane at the point of production in the rumen, rather than attempting to manage emissions downstream, and because methane is a short-lived climate pollutant where near-term reductions can deliver rapid climate benefits.
However, the cradle-to-grave lifecycle assessment shows a lower net climate benefit than the in vivo methane reduction figures suggest.
Méité et al.,2024 demonstrates that a 65% reduction in enteric methane translates to a 23% reduction in whole-system GWP per liter of milk, once feed production, manure management, seaweed cultivation and transport are fully accounted for.
Screening-Level Calculation Based on Market Adoption and LCA Evidence
Note: The mitigation potential estimates presented here are screening-level calculations to establish order-of-magnitude plausibility under specific adoption scenarios. Each estimate is derived by combining published LCA values for whole-system GHG performance with assumptions about market size and adoption rates. All figures should be treated as indicative only.
Mitigation Potential (Dairy Cattle)
|
2030 |
2050 |
| Market size |
$153M |
$1,763M |
| Cost per cow per year |
$365 |
$109.50 |
| Cows supplemented |
~419,000 |
~16.1 million |
| Share of global dairy herd |
~0.16% |
~6.0% |
| Asparagopsis required (dry) |
~3,670 t/yr |
~141,000 t/yr |
| Asparagopsis required (wet) |
~30,600 t ww/yr |
~1,175,000 t ww/yr |
| Mitigation |
~0.96 Mt CO2e/yr |
~37.5 Mt CO2e/yr |
Note: We did not assess the mitigation potential for beef cattle because of the absence of an ISO-compliant LCA analysis for those systems.
Step 1 — The Evidence Base
The calculations for emissions reduction is based on
Méité et al.,2024, which models
Asparagopsis taxiformis supplementation in two synthetic German dairy farms supplied by a land-based Swedish production facility.
| Feature |
Detail |
| Species |
Asparagopsis taxiformis |
| Production system |
Land-based facility, Lysekil, Sweden |
| Electricity grid |
Low-carbon Swedish mix (~45 g CO2e/kWh) |
| Farm system |
Two synthetic confined German dairy farms |
| Functional unit |
1 kg fat- and protein-corrected milk |
| |
|
Note:
Thomas et al. (2025), the most comprehensive multi-species LCA available, tested
Asparagopsis taxiformis (AT) in a dairy scenario but using pilot-scale freeze-drying and harvesting by scuba divers. Their AT dairy scenario produced worse outcomes than baseline. The industry is moving toward oil-based formulations that avoid freeze-drying, but no LCA yet exists for this route.
Méité et al.,2024 was chosen here because it attempts to evaluate complementary mitigation strategies (e.g. nutritional adjustments, manure management) and optimization in upstream processing such as drying.
Step 2 — Displacement Factor: Change in Emissions Intensity vs. Baseline
| Scenario |
Emissions Intensity (kg CO2e/L milk) |
vs Baseline |
| No supplement (baseline) |
1.014 |
— |
| Low dose — 0.5% OM/day |
0.914 |
-10% |
| High dose — 1% OM/day |
0.781 |
-23% |
| Displacement |
0.233 |
|
Step 3 — Cost Assumptions
The supplement cost figures are drawn from the
World Bank Global Seaweed: New and Emerging Markets Report (2023) and relate to the cost of feeding
Asparagopsis-based supplements to beef cattle. Note: These are applied here to dairy cattle as the best available published cost estimate; no equivalent published cost figure exists specifically for dairy supplementation.
The decline from $1.00 to $0.30/day reflects anticipated cost reductions as
Asparagopsis production scales and processing technology matures.
Step 4 —Market Size and Herd Coverage
Step 5- Mitigation:
| Parameter |
2030 |
2050 |
Source |
| Cows supplemented |
~419,000 |
~16.1 million |
Above |
| Milk per cow per year |
10,000 L |
10,000 L |
AHDB (Using US as the example) |
| Displacement per liter |
0.233 kg CO2e/L |
0.233 kg CO2e/L |
Step 2 |
| Gross mitigation |
~0.96 Mt CO₂e/yr |
~37.5 Mt CO2e/yr |
Derived (Cows supplemented*Displacement per liter * Milk per cow per year) |
| As % of global dairy emissions (~2.9 Gt) |
~0.024% |
~0.9% |
Derived |
Asparagopsis supply required:
| Parameter |
2030 |
2050 |
Source |
| Daily DM intake per cow |
20 kg DM/day |
20 kg DM/day |
Standard dairy nutrition |
| OM content of DM |
95% |
95% |
Standard |
| Inclusion rate (high dose) |
1% of OM/day |
1% of OM/day |
Méité et al.,(2024) |
| Daily Asparagopsis dry weight per cow |
~0.024 kg/day |
~0.024 kg/day |
Derived |
| Annual dry weight per cow |
~8.76 kg/yr |
~8.76 kg/yr |
0.024 × 365 |
| Total dry weight required |
~3,670 t dry/yr |
~141,000 t dry/yr |
Cows × 8.76 ÷ 10⁶ |
Key Assumptions
| Assumption |
Value used |
Uncertainty |
| Displacement factor |
0.233 kg CO2e/L |
High-dose optimized scenario only; requires low-carbon grid and full herd supplementation; falls to 0.093 kg CO2e/L at low dose |
| Supplement cost 2030 |
$1.00/cow/day ($365/yr) |
World Bank (2023) beef cattle cost applied to dairy; may differ for dairy systems |
| Supplement cost 2050 |
$0.30/cow/day ($109.50/yr) |
Assumes cost reduction with scale and shift to oil-based formulation |
| Cost basis |
Beef cattle costs applied to dairy |
No equivalent published dairy-specific cost figure |
| 13% CAGR |
11.52× market multiplier |
Higher than general seaweed market growth (~8% CAGR); assumes sustained commercial momentum |
| Addressable market |
Confined dairy systems only |
~70% of global enteric methane from pasture systems with no current delivery mechanism |
| Processing route |
Low-energy drying assumed |
Commercial trajectory toward oil-based formulation; |
| Bromoform atmospheric fate |
Not included |
Potential ozone depletion contribution still unquantified |
| Mitigation for beef feedlots and pasture systems |
Not included |
Need better LCAs (beef systems) and implementation plan in pasture systems |
|
|
|
Context
Livestock agriculture is responsible for approximately
7.1 Gt CO2e (2005 reference), of which enteric fermentation from ruminants accounts for 40%. Ruminant livestock (cattle, sheep, goats) produce methane (CH₄) in their rumen, which they belch into the atmosphere. Although methane persists in the atmosphere for a shorter period (around 10 years) compared to other GHGs, its global warming potential is approximately 28 times higher than that of carbon dioxide over a 100-year period (
Lashof & Ahuja, 1990), making emissions reductions a high leverage priority. Without intervention, emissions from livestock supply chains are projected to rise to 9.1 Gt
CO2e by 2050, driven by growing global demand for meat and dairy products (
FAO, 2023).
Seaweed-derived feed additives, particularly
Asparagopsis taxiformis, which accumulates the bioactive compound bromoform have demonstrated under controlled conditions the potential to reduce enteric methane emissions by 40–98% in ruminants (
Kinley et al., 2020;
Roque et al., 2021). This has generated significant interest because the intervention targets methane at the point of production in the rumen, rather than attempting to manage emissions downstream, and because methane is a short-lived climate pollutant where near-term reductions can deliver rapid climate benefits.
However, the cradle-to-grave lifecycle assessment shows a lower net climate benefit than the in vivo methane reduction figures suggest.
Méité et al.,2024 demonstrates that a 65% reduction in enteric methane translates to a 23% reduction in whole-system GWP per liter of milk, once feed production, manure management, seaweed cultivation and transport are fully accounted for.
Screening-Level Calculation Based on Market Adoption and LCA Evidence
Note: The mitigation potential estimates presented here are screening-level calculations to establish order-of-magnitude plausibility under specific adoption scenarios. Each estimate is derived by combining published LCA values for whole-system GHG performance with assumptions about market size and adoption rates. All figures should be treated as indicative only.
Mitigation Potential (Dairy Cattle)
|
2030 |
2050 |
| Market size |
$153M |
$1,763M |
| Cost per cow per year |
$365 |
$109.50 |
| Cows supplemented |
~419,000 |
~16.1 million |
| Share of global dairy herd |
~0.16% |
~6.0% |
| Asparagopsis required (dry) |
~3,670 t/yr |
~141,000 t/yr |
| Asparagopsis required (wet) |
~30,600 t ww/yr |
~1,175,000 t ww/yr |
| Mitigation |
~0.69 Mt CO2e/yr |
~26.6 Mt CO2e/yr |
Note: We did not assess the mitigation potential for beef cattle because of the absence of an ISO-compliant LCA analysis for those systems.
Step 1 — The Evidence Base
The calculations for emissions reduction is based on
Méité et al.,2024, which models
Asparagopsis taxiformis supplementation in two synthetic German dairy farms supplied by a land-based Swedish production facility.
| Feature |
Detail |
| Species |
Asparagopsis taxiformis |
| Production system |
Land-based facility, Lysekil, Sweden |
| Electricity grid |
Low-carbon Swedish mix (~45 g CO2e/kWh) |
| Farm system |
Two synthetic confined German dairy farms |
| Functional unit |
1 kg fat- and protein-corrected milk |
| |
|
Note:
Thomas et al. (2025), the most comprehensive multi-species LCA available, tested
Asparagopsis taxiformis (AT) in a dairy scenario but using pilot-scale freeze-drying and harvesting by scuba divers. Their AT dairy scenario produced worse outcomes than baseline. The industry is moving toward oil-based formulations that avoid freeze-drying, but no LCA yet exists for this route.
Méité et al.,2024 was chosen here because it attempts to evaluate complementary mitigation strategies (e.g. nutritional adjustments, manure management) and optimization in upstream processing such as drying.
Step 2 — Displacement Factor: Change in Emissions Intensity vs. Baseline
| Scenario |
Emissions Intensity (kg CO2e/L milk) |
vs Baseline |
| No supplement (baseline) |
1.014 |
— |
| Low dose — 0.5% OM/day |
0.914 |
-10% |
| High dose — 1% OM/day |
0.781 |
-23% |
| Displacement |
0.233 |
|
Step 3 — Cost Assumptions
The supplement cost figures are drawn from the
World Bank Global Seaweed: New and Emerging Markets Report (2023) and relate to the cost of feeding
Asparagopsis-based supplements to beef cattle. Note: These are applied here to dairy cattle as the best available published cost estimate; no equivalent published cost figure exists specifically for dairy supplementation.
The decline from $1.00 to $0.30/day reflects anticipated cost reductions as
Asparagopsis production scales and processing technology matures.
Step 4 —Market Size and Herd Coverage
Step 5- Mitigation:
| Parameter |
2030 |
2050 |
Source |
| Cows supplemented |
~419,000 |
~16.1 million |
Above |
| Milk per cow per year |
7,100 L |
7,100 L |
AHDB (Using France as the example) |
| Displacement per liter |
0.233 kg CO2e/L |
0.233 kg CO2e/L |
Step 2 |
| Gross mitigation |
~0.69 Mt CO₂e/yr |
~26.6 Mt CO2e/yr |
Derived (Cows supplemented*Displacement per liter * Milk per cow per year) |
| As % of global dairy emissions (~2.9 Gt) |
~0.024% |
~0.9% |
Derived |
Asparagopsis supply required:
| Parameter |
2030 |
2050 |
Source |
| Daily DM intake per cow |
20 kg DM/day |
20 kg DM/day |
Standard dairy nutrition |
| OM content of DM |
95% |
95% |
Standard |
| Inclusion rate (high dose) |
1% of OM/day |
1% of OM/day |
Méité et al.,(2024) |
| Daily Asparagopsis dry weight per cow |
~0.024 kg/day |
~0.024 kg/day |
Derived |
| Annual dry weight per cow |
~8.76 kg/yr |
~8.76 kg/yr |
0.024 × 365 |
| Total dry weight required |
~3,670 t dry/yr |
~141,000 t dry/yr |
Cows × 8.76 ÷ 10⁶ |
Key Assumptions
| Assumption |
Value used |
Uncertainty |
| Displacement factor |
0.233 kg CO2e/L |
High-dose optimized scenario only; requires low-carbon grid and full herd supplementation; falls to 0.093 kg CO2e/L at low dose |
| Supplement cost 2030 |
$1.00/cow/day ($365/yr) |
World Bank (2023) beef cattle cost applied to dairy; may differ for dairy systems |
| Supplement cost 2050 |
$0.30/cow/day ($109.50/yr) |
Assumes cost reduction with scale and shift to oil-based formulation |
| Cost basis |
Beef cattle costs applied to dairy |
No equivalent published dairy-specific cost figure |
| 13% CAGR |
11.52× market multiplier |
Higher than general seaweed market growth (~8% CAGR); assumes sustained commercial momentum |
| Addressable market |
Confined dairy systems only |
~70% of global enteric methane from pasture systems with no current delivery mechanism |
| Processing route |
Low-energy drying assumed |
Commercial trajectory toward oil-based formulation; |
| Bromoform atmospheric fate |
Not included |
Potential ozone depletion contribution still unquantified |
| Mitigation for beef feedlots and pasture systems |
Not included |
Need better LCAs (beef systems) and implementation plan in pasture systems |
|
|
|
Context
Livestock agriculture is responsible for approximately
7.1 Gt CO2e (2005 reference), of which enteric fermentation from ruminants accounts for 40%. Ruminant livestock (cattle, sheep, goats) produce methane (CH₄) in their rumen, which they belch into the atmosphere. Although methane persists in the atmosphere for a shorter period (around 10 years) compared to other GHGs, its global warming potential is approximately 28 times higher than that of carbon dioxide over a 100-year period (
Lashof & Ahuja, 1990), making emissions reductions a high leverage priority. Without intervention, emissions from livestock supply chains are projected to rise to 9.1 Gt
CO2e by 2050, driven by growing global demand for meat and dairy products (
FAO, 2023).
Seaweed-derived feed additives, particularly
Asparagopsis taxiformis, which accumulates the bioactive compound bromoform have demonstrated under controlled conditions the potential to reduce enteric methane emissions by 40–98% in ruminants (
Kinley et al., 2020;
Roque et al., 2021). This has generated significant interest because the intervention targets methane at the point of production in the rumen, rather than attempting to manage emissions downstream, and because methane is a short-lived climate pollutant where near-term reductions can deliver rapid climate benefits.
However, the cradle-to-grave lifecycle assessment shows a lower net climate benefit than the in vivo methane reduction figures suggest.
Méité et al.,2024 demonstrates that a 65% reduction in enteric methane translates to a 23% reduction in whole-system GWP per liter of milk, once feed production, manure management, seaweed cultivation and transport are fully accounted for.
Screening-Level Calculation Based on Market Adoption and LCA Evidence
Note: The mitigation potential estimates presented here are screening-level calculations to establish order-of-magnitude plausibility under specific adoption scenarios. Each estimate is derived by combining published LCA values for whole-system GHG performance with assumptions about market size and adoption rates. All figures should be treated as indicative only.
Mitigation Potential (Dairy Cattle)
|
2030 |
2050 |
| Market size |
$153M |
$1,763M |
| Cost per cow per year |
$365 |
$109.50 |
| Cows supplemented |
~419,000 |
~16.1 million |
| Share of global dairy herd |
~0.16% |
~6.0% |
| Asparagopsis required (dry) |
~3,670 t/yr |
~141,000 t/yr |
| Asparagopsis required (wet) |
~30,600 t ww/yr |
~1,175,000 t ww/yr |
| Mitigation |
~0.69 Mt CO2e/yr |
~26.6 Mt CO2e/yr |
Note: We did not assess the mitigation potential for beef cattle because of the absence of an ISO-compliant LCA analysis for those systems.
Step 1 — The Evidence Base
The calculations for emissions reduction is based on
Méité et al.,2024, which models
Asparagopsis taxiformis supplementation in two synthetic German dairy farms supplied by a land-based Swedish production facility.
| Feature |
Detail |
| Species |
Asparagopsis taxiformis |
| Production system |
Land-based facility, Lysekil, Sweden |
| Electricity grid |
Low-carbon Swedish mix (~45 g CO2e/kWh) |
| Farm system |
Two synthetic confined German dairy farms |
| Functional unit |
1 kg fat- and protein-corrected milk |
| |
|
Note:
Thomas et al. (2025), the most comprehensive multi-species LCA available, tested
Asparagopsis taxiformis (AT) in a dairy scenario but using pilot-scale freeze-drying and harvesting by scuba divers. Their AT dairy scenario produced worse outcomes than baseline. The industry is moving toward oil-based formulations that avoid freeze-drying, but no LCA yet exists for this route.
Méité et al.,2024 was chosen here because it attempts to evaluate complementary mitigation strategies (e.g. nutritional adjustments, manure management) and optimization in upstream processing such as drying.
Step 2 — Displacement Factor
| Scenario |
GWP (kg CO2e/L milk) |
vs Baseline |
| No supplement (baseline) |
1.014 |
— |
| Low dose — 0.5% OM/day |
0.914 |
-10% |
| High dose — 1% OM/day |
0.781 |
-23% |
| Displacement |
0.233 |
|
Step 3 — Cost Assumptions
The supplement cost figures are drawn from the
World Bank Global Seaweed: New and Emerging Markets Report (2023) and relate to the cost of feeding
Asparagopsis-based supplements to beef cattle. Note: These are applied here to dairy cattle as the best available published cost estimate; no equivalent published cost figure exists specifically for dairy supplementation.
The decline from $1.00 to $0.30/day reflects anticipated cost reductions as
Asparagopsis production scales and processing technology matures.
Step 4 —Market Size and Herd Coverage
Step 5- Mitigation:
| Parameter |
2030 |
2050 |
Source |
| Cows supplemented |
~419,000 |
~16.1 million |
Above |
| Milk per cow per year |
7,100 L |
7,100 L |
FAO |
| Displacement per liter |
0.233 kg CO2e/L |
0.233 kg CO2e/L |
Step 2 |
| Gross mitigation |
~0.69 Mt CO₂e/yr |
~26.6 Mt CO2e/yr |
Derived |
| As % of global dairy emissions (~2.9 Gt) |
~0.024% |
~0.9% |
Derived |
Asparagopsis supply required:
| Parameter |
2030 |
2050 |
Source |
| Daily DM intake per cow |
20 kg DM/day |
20 kg DM/day |
Standard dairy nutrition |
| OM content of DM |
95% |
95% |
Standard |
| Inclusion rate (high dose) |
1% of OM/day |
1% of OM/day |
Méité et al.,(2024) |
| Daily Asparagopsis dry weight per cow |
~0.024 kg/day |
~0.024 kg/day |
Derived |
| Annual dry weight per cow |
~8.76 kg/yr |
~8.76 kg/yr |
0.024 × 365 |
| Total dry weight required |
~3,670 t dry/yr |
~141,000 t dry/yr |
Cows × 8.76 ÷ 10⁶ |
Key Assumptions
| Assumption |
Value used |
Uncertainty |
| Displacement factor |
0.233 kg CO2e/L |
High-dose optimized scenario only; requires low-carbon grid and full herd supplementation; falls to 0.093 kg CO2e/L at low dose |
| Supplement cost 2030 |
$1.00/cow/day ($365/yr) |
World Bank (2023) beef cattle cost applied to dairy; may differ for dairy systems |
| Supplement cost 2050 |
$0.30/cow/day ($109.50/yr) |
Assumes cost reduction with scale and shift to oil-based formulation |
| Cost basis |
Beef cattle costs applied to dairy |
No equivalent published dairy-specific cost figure |
| Milk yield penalty |
Not applied |
Freeze-dried formulation causes 12% yield decrease (Méité et al.); oil-based formulations show no penalty (Alvarez-Hess et al., 2023) |
| 13% CAGR |
11.52× market multiplier |
Higher than general seaweed market growth (~8% CAGR); assumes sustained commercial momentum |
| Addressable market |
Confined dairy systems only |
~70% of global enteric methane from pasture systems with no current delivery mechanism |
| Processing route |
Low-energy drying assumed |
Commercial trajectory toward oil-based formulation; no LCA published for this route |
| Bromoform atmospheric fate |
Not included |
Potential ozone depletion contribution still unquantified |
| Mitigation for beef feedlots and pasture systems |
Not included |
Need better LCAs (beef systems) and implementation plan in pasture systems |
|
|
|
Context
Livestock agriculture is responsible for approximately
7.1 Gt CO₂e (2005 reference), of which enteric fermentation from ruminants accounts for 40%. Ruminant livestock (cattle, sheep, goats) produce methane (CH₄) in their rumen, which they belch into the atmosphere. Although methane persists in the atmosphere for a shorter period (around 10 years) compared to other GHGs, its global warming potential is approximately 28 times higher than that of carbon dioxide over a 100-year period (
Lashof & Ahuja, 1990), making emissions reductions a high leverage priority. Without intervention, emissions from livestock supply chains are projected to rise to 9.1 Gt CO₂e by 2050, driven by growing global demand for meat and dairy products (
FAO, 2023).
Seaweed-derived feed additives, particularly
Asparagopsis taxiformis, which accumulates the bioactive compound bromoform have demonstrated under controlled conditions the potential to reduce enteric methane emissions by 40–98% in ruminants (
Kinley et al., 2020;
Roque et al., 2021). This has generated significant interest because the intervention targets methane at the point of production in the rumen, rather than attempting to manage emissions downstream, and because methane is a short-lived climate pollutant where near-term reductions can deliver rapid climate benefits.
However, the cradle-to-grave lifecycle assessment shows a lower net climate benefit than the in vivo methane reduction figures suggest.
Méité et al.,2024 demonstrates that a 65% reduction in enteric methane translates to a 23% reduction in whole-system GWP per liter of milk, once feed production, manure management, seaweed cultivation and transport are fully accounted for.
Screening-Level Calculation Based on Market Adoption and LCA Evidence
Note: The mitigation potential estimates presented here are screening-level calculations to establish order-of-magnitude plausibility under specific adoption scenarios. Each estimate is derived by combining published LCA values for whole-system GHG performance with assumptions about market size and adoption rates. All figures should be treated as indicative only.
Mitigation Potential (Dairy Cattle)
|
2030 |
2050 |
| Market size |
$153M |
$1,763M |
| Cost per cow per year |
$365 |
$109.50 |
| Cows supplemented |
~419,000 |
~16.1 million |
| Share of global dairy herd |
~0.16% |
~6.0% |
| Asparagopsis required (dry) |
~3,670 t/yr |
~141,000 t/yr |
| Asparagopsis required (wet) |
~30,600 t ww/yr |
~1,175,000 t ww/yr |
| Mitigation |
~0.69 Mt CO₂e/yr |
~26.6 Mt CO₂e/yr |
Note: We did not assess the mitigation potential for beef cattle because of the absence of an ISO-compliant LCA analysis for those systems.
Step 1 — The Evidence Base
The calculations for emissions reduction is based on
Méité et al.,2024, which models
Asparagopsis taxiformis supplementation in two synthetic German dairy farms supplied by a land-based Swedish production facility.
| Feature |
Detail |
| Species |
Asparagopsis taxiformis |
| Production system |
Land-based facility, Lysekil, Sweden |
| Electricity grid |
Low-carbon Swedish mix (~45 g CO₂e/kWh) |
| Farm system |
Two synthetic confined German dairy farms |
| Functional unit |
1 kg fat- and protein-corrected milk |
| |
|
Note:
Thomas et al. (2025), the most comprehensive multi-species LCA available, tested
Asparagopsis taxiformis (AT) in a dairy scenario but using pilot-scale freeze-drying and harvesting by scuba divers. Their AT dairy scenario produced worse outcomes than baseline. The industry is moving toward oil-based formulations that avoid freeze-drying, but no LCA yet exists for this route.
Méité et al.,2024 was chosen here because it attempts to evaluate complementary mitigation strategies (e.g. nutritional adjustments, manure management) and optimization in upstream processing such as drying.
Step 2 — Displacement Factor
| Scenario |
GWP (kg CO₂e/L milk) |
vs Baseline |
| No supplement (baseline) |
1.014 |
— |
| Low dose — 0.5% OM/day |
0.914 |
-10% |
| High dose — 1% OM/day |
0.781 |
-23% |
| Displacement |
0.233 |
|
Step 3 — Cost Assumptions
The supplement cost figures are drawn from the
World Bank Global Seaweed: New and Emerging Markets Report (2023) and relate to the cost of feeding
Asparagopsis-based supplements to beef cattle. Note: These are applied here to dairy cattle as the best available published cost estimate; no equivalent published cost figure exists specifically for dairy supplementation.
The decline from $1.00 to $0.30/day reflects anticipated cost reductions as
Asparagopsis production scales and processing technology matures.
Step 4 —Market Size and Herd Coverage
Step 5- Mitigation:
| Parameter |
2030 |
2050 |
Source |
| Cows supplemented |
~419,000 |
~16.1 million |
Above |
| Milk per cow per year |
7,100 L |
7,100 L |
FAO |
| Displacement per liter |
0.233 kg CO₂e/L |
0.233 kg CO₂e/L |
Step 2 |
| Gross mitigation |
~0.69 Mt CO₂e/yr |
~26.6 Mt CO₂e/yr |
Derived |
| As % of global dairy emissions (~2.9 Gt) |
~0.024% |
~0.9% |
Derived |
Asparagopsis supply required:
| Parameter |
2030 |
2050 |
Source |
| Daily DM intake per cow |
20 kg DM/day |
20 kg DM/day |
Standard dairy nutrition |
| OM content of DM |
95% |
95% |
Standard |
| Inclusion rate (high dose) |
1% of OM/day |
1% of OM/day |
Méité et al.,(2024) |
| Daily Asparagopsis dry weight per cow |
~0.024 kg/day |
~0.024 kg/day |
Derived |
| Annual dry weight per cow |
~8.76 kg/yr |
~8.76 kg/yr |
0.024 × 365 |
| Total dry weight required |
~3,670 t dry/yr |
~141,000 t dry/yr |
Cows × 8.76 ÷ 10⁶ |
Key Assumptions
| Assumption |
Value used |
Uncertainty |
| Displacement factor |
0.233 kg CO₂e/L |
High-dose optimized scenario only; requires low-carbon grid and full herd supplementation; falls to 0.093 kg CO₂e/L at low dose |
| Supplement cost 2030 |
$1.00/cow/day ($365/yr) |
World Bank (2023) beef cattle cost applied to dairy; may differ for dairy systems |
| Supplement cost 2050 |
$0.30/cow/day ($109.50/yr) |
Assumes cost reduction with scale and shift to oil-based formulation |
| Cost basis |
Beef cattle costs applied to dairy |
No equivalent published dairy-specific cost figure |
| Milk yield penalty |
Not applied |
Freeze-dried formulation causes 12% yield decrease (Méité et al.); oil-based formulations show no penalty (Alvarez-Hess et al., 2023) |
| 13% CAGR |
11.52× market multiplier |
Higher than general seaweed market growth (~8% CAGR); assumes sustained commercial momentum |
| Addressable market |
Confined dairy systems only |
~70% of global enteric methane from pasture systems with no current delivery mechanism |
| Processing route |
Low-energy drying assumed |
Commercial trajectory toward oil-based formulation; no LCA published for this route |
| Bromoform atmospheric fate |
Not included |
Potential ozone depletion contribution still unquantified |
| Mitigation for beef feedlots and pasture systems |
Not included |
Need better LCAs an(beef systems) and implementation plan in pasture systems |
|
|
|
Context
Livestock agriculture is responsible for approximately
7.1 Gt CO₂e (2005 reference), of which enteric fermentation from ruminants accounts for 40%. Ruminant livestock (cattle, sheep, goats) produce methane (CH₄) in their rumen, which they belch into the atmosphere. Although methane persists in the atmosphere for a shorter period (around 10 years) compared to other GHGs, its global warming potential is approximately 28 times higher than that of carbon dioxide over a 100-year period (
Lashof & Ahuja, 1990), making emissions reductions a high leverage priority. Without intervention, emissions from livestock supply chains are projected to rise to 9.1 Gt CO₂e by 2050, driven by growing global demand for meat and dairy products (
FAO, 2023).
Seaweed-derived feed additives, particularly
Asparagopsis taxiformis, which accumulates the bioactive compound bromoform have demonstrated under controlled conditions the potential to reduce enteric methane emissions by 40–98% in ruminants (
Kinley et al., 2020;
Roque et al., 2021). This has generated significant interest because the intervention targets methane at the point of production in the rumen, rather than attempting to manage emissions downstream, and because methane is a short-lived climate pollutant where near-term reductions can deliver rapid climate benefits.
However, the cradle-to-grave lifecycle assessment shows a lower net climate benefit than the in vivo methane reduction figures suggest.
Méité et al.,2024 demonstrates that a 65% reduction in enteric methane translates to a 23% reduction in whole-system GWP per liter of milk, once feed production, manure management, seaweed cultivation and transport are fully accounted for.
Screening-Level Calculation Based on Market Adoption and LCA Evidence
Note: The mitigation potential estimates presented here are screening-level calculations to establish order-of-magnitude plausibility under specific adoption scenarios. Each estimate is derived by combining published LCA values for whole-system GHG performance with assumptions about market size and adoption rates. All figures should be treated as indicative only.
Mitigation Potential (Dairy Cattle)
|
2030 |
2050 |
| Market size |
$153M |
$1,763M |
| Cost per cow per year |
$365 |
$109.50 |
| Cows supplemented |
~419,000 |
~16.1 million |
| Share of global dairy herd |
~0.16% |
~6.0% |
| Asparagopsis required (dry) |
~3,670 t/yr |
~141,000 t/yr |
| Asparagopsis required (wet) |
~30,600 t ww/yr |
~1,175,000 t ww/yr |
| Mitigation |
~0.69 Mt CO₂e/yr |
~26.6 Mt CO₂e/yr |
Note: We did not assess the mitigation potential for beef cattle because of the absence of an ISO-compliant LCA analysis for those systems.
Step 1 — The Evidence Base
The calculations for emissions reduction is based on
Méité et al.,2024, which models
Asparagopsis taxiformis supplementation in two synthetic German dairy farms supplied by a land-based Swedish production facility.
| Feature |
Detail |
| Species |
Asparagopsis taxiformis |
| Production system |
Land-based facility, Lysekil, Sweden |
| Electricity grid |
Low-carbon Swedish mix (~45 g CO₂e/kWh) |
| Farm system |
Two synthetic confined German dairy farms |
| Functional unit |
1 kg fat- and protein-corrected milk |
| |
|
Note:
Thomas et al. (2025), the most comprehensive multi-species LCA available, tested
Asparagopsis taxiformis (AT) in a dairy scenario but using pilot-scale freeze-drying and harvesting by scuba divers. Their AT dairy scenario produced worse outcomes than baseline. The industry is moving toward oil-based formulations that avoid freeze-drying, but no LCA yet exists for this route.
Méité et al.,2024 was chosen here because it attempts to evaluate complementary mitigation strategies (e.g. nutritional adjustments, manure management) and optimization in upstream processing such as drying.
Step 2 — Displacement Factor
| Scenario |
GWP (kg CO₂e/L milk) |
vs Baseline |
| No supplement (baseline) |
1.014 |
— |
| Low dose — 0.5% OM/day |
0.914 |
-10% |
| High dose — 1% OM/day |
0.781 |
-23% |
| Displacement |
0.233 |
|
Step 3 — Cost Assumptions
The supplement cost figures are drawn from the
World Bank Global Seaweed: New and Emerging Markets Report (2023) and relate to the cost of feeding
Asparagopsis-based supplements to beef cattle. Note: These are applied here to dairy cattle as the best available published cost estimate; no equivalent published cost figure exists specifically for dairy supplementation.
The decline from $1.00 to $0.30/day reflects anticipated cost reductions as
Asparagopsis production scales and processing technology matures.
Step 4 —Market Size and Herd Coverage
Step 5- Mitigation:
| Parameter |
2030 |
2050 |
Source |
| Cows supplemented |
~419,000 |
~16.1 million |
Above |
| Milk per cow per year |
7,100 L |
7,100 L |
FAO |
| Displacement per liter |
0.233 kg CO₂e/L |
0.233 kg CO₂e/L |
Step 2 |
| Gross mitigation |
~0.69 Mt CO₂e/yr |
~26.6 Mt CO₂e/yr |
Derived |
| As % of global dairy emissions (~2.9 Gt) |
~0.024% |
~0.9% |
Derived |
Asparagopsis supply required:
| Parameter |
2030 |
2050 |
Source |
| Daily DM intake per cow |
20 kg DM/day |
20 kg DM/day |
Standard dairy nutrition |
| OM content of DM |
95% |
95% |
Standard |
| Inclusion rate (high dose) |
1% of OM/day |
1% of OM/day |
Méité et al.,(2024) |
| Daily Asparagopsis dry weight per cow |
~0.024 kg/day |
~0.024 kg/day |
Derived |
| Annual dry weight per cow |
~8.76 kg/yr |
~8.76 kg/yr |
0.024 × 365 |
| Total dry weight required |
~3,670 t dry/yr |
~141,000 t dry/yr |
Cows × 8.76 ÷ 10⁶ |
Key Assumptions
| Assumption |
Value used |
Uncertainty |
| Displacement factor |
0.233 kg CO₂e/L |
High-dose optimized scenario only; requires low-carbon grid and full herd supplementation; falls to 0.093 kg CO₂e/L at low dose |
| Supplement cost 2030 |
$1.00/cow/day ($365/yr) |
World Bank (2023) beef cattle cost applied to dairy; may differ for dairy systems |
| Supplement cost 2050 |
$0.30/cow/day ($109.50/yr) |
Assumes cost reduction with scale and shift to oil-based formulation |
| Cost basis |
Beef cattle costs applied to dairy |
No equivalent published dairy-specific cost figure |
| Milk yield penalty |
Not applied |
Freeze-dried formulation causes 12% yield decrease (Méité et al.); oil-based formulations show no penalty (Alvarez-Hess et al., 2023) |
| 13% CAGR |
11.52× market multiplier |
Higher than general seaweed market growth (~8% CAGR); assumes sustained commercial momentum |
| Addressable market |
Confined dairy systems only |
~70% of global enteric methane from pasture systems with no current delivery mechanism |
| Processing route |
Low-energy drying assumed |
Commercial trajectory toward oil-based formulation; no LCA published for this route |
| Bromoform atmospheric fate |
Not included |
Potential ozone depletion contribution still unquantified |
| Mitigation for beef feedlots and pasture systems |
Not included |
Could |
Context
Livestock agriculture is responsible for approximately
7.1 Gt CO₂e (2005 reference), of which enteric fermentation from ruminants accounts for 40%. Ruminant livestock (cattle, sheep, goats) produce methane (CH₄) in their rumen, which they belch into the atmosphere. Although methane persists in the atmosphere for a shorter period (around 10 years) compared to other GHGs, its global warming potential is approximately 28 times higher than that of carbon dioxide over a 100-year period (
Lashof & Ahuja, 1990), making emissions reductions a high leverage priority. Without intervention, emissions from livestock supply chains are projected to rise to 9.1 Gt CO₂e by 2050, driven by growing global demand for meat and dairy products (
FAO, 2023).
Seaweed-derived feed additives, particularly
Asparagopsis taxiformis, which accumulates the bioactive compound bromoform have demonstrated under controlled conditions the potential to reduce enteric methane emissions by 40–98% in ruminants (
Kinley et al., 2020;
Roque et al., 2021). This has generated significant interest because the intervention targets methane at the point of production in the rumen, rather than attempting to manage emissions downstream, and because methane is a short-lived climate pollutant where near-term reductions can deliver rapid climate benefits.
However, the cradle-to-grave lifecycle assessment shows a lower net climate benefit than the in vivo methane reduction figures suggest.
Méité et al.,2024 demonstrates that a 65% reduction in enteric methane translates to a 23% reduction in whole-system GWP per liter of milk, once feed production, manure management, seaweed cultivation and transport are fully accounted for.
Screening-Level Calculation Based on Market Adoption and LCA Evidence
Note: The mitigation potential estimates presented here are screening-level calculations to establish order-of-magnitude plausibility under specific adoption scenarios. Each estimate is derived by combining published LCA values for whole-system GHG performance with assumptions about market size and adoption rates. All figures should be treated as indicative only.
Mitigation Potential (Dairy Cattle)
|
2030 |
2050 |
| Market size |
$153M |
$1,763M |
| Cost per cow per year |
$365 |
$109.50 |
| Cows supplemented |
~419,000 |
~16.1 million |
| Share of global dairy herd |
~0.16% |
~6.0% |
| Asparagopsis required (dry) |
~3,670 t/yr |
~141,000 t/yr |
| Asparagopsis required (wet) |
~30,600 t ww/yr |
~1,175,000 t ww/yr |
| Mitigation |
~0.69 Mt CO₂e/yr |
~26.6 Mt CO₂e/yr |
Note: We did not assess the mitigation potential for beef cattle because of the absence of an ISO-compliant LCA analysis for those systems.
Step 1 — The Evidence Base
The calculations for emissions reduction is based on
Méité et al.,2024, which models
Asparagopsis taxiformis supplementation in two synthetic German dairy farms supplied by a land-based Swedish production facility.
| Feature |
Detail |
| Species |
Asparagopsis taxiformis |
| Production system |
Land-based facility, Lysekil, Sweden |
| Electricity grid |
Low-carbon Swedish mix (~45 g CO₂e/kWh) |
| Farm system |
Two synthetic confined German dairy farms |
| Functional unit |
1 kg fat- and protein-corrected milk |
| |
|
Note:
Thomas et al. (2025), the most comprehensive multi-species LCA available, tested
Asparagopsis taxiformis (AT) in a dairy scenario but using pilot-scale freeze-drying and harvesting by scuba divers. Their AT dairy scenario produced worse outcomes than baseline. The industry is moving toward oil-based formulations that avoid freeze-drying, but no LCA yet exists for this route.
Méité et al.,2024 was chosen here because it attempts to evaluate complementary mitigation strategies (e.g. nutritional adjustments, manure management) and optimization in upstream processing such as drying.
Step 2 — Displacement Factor
| Scenario |
GWP (kg CO₂e/L milk) |
vs Baseline |
| No supplement (baseline) |
1.014 |
— |
| Low dose — 0.5% OM/day |
0.914 |
-10% |
| High dose — 1% OM/day |
0.781 |
-23% |
| Displacement |
0.233 |
|
Step 3 — Cost Assumptions
The supplement cost figures are drawn from the
World Bank Global Seaweed: New and Emerging Markets Report (2023) and relate to the cost of feeding
Asparagopsis-based supplements to beef cattle. Note: These are applied here to dairy cattle as the best available published cost estimate; no equivalent published cost figure exists specifically for dairy supplementation.
| Parameter |
2030 |
2050 |
Source |
| Cost per cow per day |
$1.00 |
$0.30 |
World Bank (2023) |
| Cost per cow per year |
$365 |
$109.50 |
Derived |
The decline from $1.00 to $0.30/day reflects anticipated cost reductions as
Asparagopsis production scales and processing technology matures.
Step 4 —Market Size and Herd Coverage
Step 5- Mitigation:
| Parameter |
2030 |
2050 |
Source |
| Cows supplemented |
~419,000 |
~16.1 million |
Above |
| Milk per cow per year |
7,100 L |
7,100 L |
FAO |
| Displacement per liter |
0.233 kg CO₂e/L |
0.233 kg CO₂e/L |
Step 2 |
| Gross mitigation |
~0.69 Mt CO₂e/yr |
~26.6 Mt CO₂e/yr |
Derived |
| As % of global dairy emissions (~2.9 Gt) |
~0.024% |
~0.9% |
Derived |
Asparagopsis supply required:
| Parameter |
2030 |
2050 |
Source |
| Daily DM intake per cow |
20 kg DM/day |
20 kg DM/day |
Standard dairy nutrition |
| OM content of DM |
95% |
95% |
Standard |
| Inclusion rate (high dose) |
1% of OM/day |
1% of OM/day |
Méité et al. (2024) |
| Daily Asparagopsis dry weight per cow |
~0.024 kg/day |
~0.024 kg/day |
Derived |
| Annual dry weight per cow |
~8.76 kg/yr |
~8.76 kg/yr |
0.024 × 365 |
| Total dry weight required |
~3,670 t dry/yr |
~141,000 t dry/yr |
Cows × 8.76 ÷ 10⁶ |
Key Assumptions
| Assumption |
Value used |
Uncertainty |
| Displacement factor |
0.233 kg CO₂e/L |
High-dose optimized scenario only; requires low-carbon grid and full herd supplementation; falls to 0.093 kg CO₂e/L at low dose |
| Supplement cost 2030 |
$1.00/cow/day ($365/yr) |
World Bank (2023) beef cattle cost applied to dairy; may differ for dairy systems |
| Supplement cost 2050 |
$0.30/cow/day ($109.50/yr) |
Assumes cost reduction with scale and shift to oil-based formulation |
| Cost basis |
Beef cattle costs applied to dairy |
No equivalent published dairy-specific cost figure |
| Milk yield penalty |
Not applied |
Freeze-dried formulation causes 12% yield decrease (Méité et al.); oil-based formulations show no penalty (Alvarez-Hess et al., 2023) |
| 13% CAGR |
11.52× market multiplier |
Higher than general seaweed market growth (~8% CAGR); assumes sustained commercial momentum |
| Addressable market |
Confined dairy systems only |
~70% of global enteric methane from pasture systems with no current delivery mechanism |
| Processing route |
Low-energy drying assumed |
Commercial trajectory toward oil-based formulation; no LCA published for this route |
| Bromoform atmospheric fate |
Not included |
Potential ozone depletion contribution still unquantified |
| Mitigation for beef feedlots and pasture systems |
Not included |
Could |
Top-line summary
Note: The mitigation potential estimates presented here are screening-level calculations to establish order-of-magnitude plausibility under specific adoption scenarios. Each estimate is derived by combining published or estimated values for current or forecasted seaweed-based product emissions performance in currently available LCAs (e.g., methane reduction per animal, GHG intensity relative to a displaced product) with assumptions about adoption rates and addressable market size.
| Scenario |
Basis / Source |
Feasibility-adjusted (×0.75) Mt CO2e/yr |
Key condition |
| Current pilot scale — freeze-drying, fossil grid |
Thomas et al. (2025) |
Increased emissions relative to baseline |
None — process must be decarbonized first |
| Optimized low-C processing — confined dairy, 5% herd |
Méité et al. (2024) |
~1.5 Mt CO2e/yr |
Low-C processing + renewable energy |
| Feedlot beef finishing |
Ridoutt et al. (2022) |
~29 Mt CO2e/yr |
Renewable energy; feedlot phase only |
| Pasture systems (~70% of global enteric CH₄) |
No LCA; no delivery mechanism |
Not calculable |
Delivery mechanism does not exist |
Table 2: Summary of achievable global mitigation potential based on current LCAs and models of Asparagopsis based methane inhibitors
Evidence Base
Under controlled conditions, seaweed-based additives — particularly
Asparagopsis taxiformis — can reduce enteric methane emissions by 40–90% in feedlot settings and up to 40% in grazing systems (
Kinley et al., 2020;
Roque et al., 2021, (Meo-Filho et al., 2024). However, the cradle-grave lifecycle picture paints a different picture.
Thomas et al. (2025) looked at 7 cradle-grave LCAs for beef, dairy and sheep and found 5 out of 7 scenarios worse than the unsupplemented baseline. For example in dairy cattle, the high energy demands of freeze-drying
Asparagopsis taxiformis (AT) under current conditions offset enteric methane savings entirely, producing a net greenhouse gas outcome
worse than the unsupplemented baseline.
Méité et al. (2024), modelling AT production from a Swedish land-based facility powered by a low-carbon grid and using a less-energy intensive drying system showed a pathway to reducing emissions: high-dose supplementation (1% of organic matter) achieves a 23% whole-system GWP reduction per liter of milk, even after accounting for non-supplemented calves and heifers. However,
Méité et al. (2024) also shows that standalone seaweed supplementation increases eutrophication and acidification even while reducing GWP.
Only a comprehensive emissions management program (including manure management) achieves simultaneous reductions across all three impact categories.
For beef cattle, sector-scale modeling by
Ridoutt et al. (2022) projected overall GHG reductions of 1–4% for the Australian beef industry by 2030 through feedlot adoption, equivalent to 0.6–2.0 Mt CO
2e. Applied proportionally across global beef production, a comparable adoption trajectory would represent potential reductions of approximately 20–65 Mt CO
2e globally — modest relative to the roughly 3.1 Gt CO
2e attributed to beef cattle annually. No ISO-compliant lifecycle analysis has yet been conducted for
Asparagopsis taxiformis in beef cattle to test whether this projection would survive full end-to-end accounting, and sector-level impact across all system types will be constrained by the dominance of pasture-based emissions, processing technology, and the practical challenge of consistent delivery outside feedlot settings. Delivery mechanism also matters:
boluses and
lick blocks may influence both effectiveness and practicality across system types (
Spark Solutions Livestock Enteric Methane Mitigation Roadmap, 2025).
Calculation
Dairy Cows
| Parameter |
Value |
Note |
| 2030 market size |
$153M |
50% of WB 2030 market size of $306M (assuming evenly between dairy and beef market) |
| Assumed price |
$0.5/cow per day or ~$180/cow per year |
Source: Agfunder |
| Cows supplemented |
~0.85 million cows ($153M/180) |
|
| Global dairy herd |
~270 million |
Source: WWF |
| Share of herd |
0.31% |
|
| Milk produced per cow per year |
~7100 L |
Source: FAO (data for German farms) |
| Reduction of emissions/liter |
0.24 kg CO2e/L |
23% reduction in emissions per L of milk Source: Méité et al. (2024); Baseline ~1.04 kg CO₂e / L milk Thomas et al. (2025) |
| Gross mitigation at this scale |
~0.85M × 7,000 L/yr × 0.24 kg CO2e/L = ~1.4 Mt CO2e/yr |
|
Table 3: Calculation of mitigation potentials for confined dairy cows
Beef Finishing
| Parameter |
Value |
Note |
| Overall GHG reductions for Australian beef industry by 2030 using AT |
1-4% |
Sector-scale modeling by Ridoutt et al. (2022) (not an LCA) |
| Worldwide emissions from beef cattle |
2.9 GT |
Source: FAO |
| Gross mitigation at this scale |
1%*2.9 GT=~29 Mt CO2e/yr |
|
Table 4: Calculation of mitigation potentials for beef in feedlot systems
Top-line summary
| Scenario |
Basis / Source |
Feasibility-adjusted (×0.75) Mt CO₂e/yr |
Key condition |
| Current pilot scale — freeze-drying, fossil grid |
Thomas et al. (2025) |
Increased emissions relative to baseline |
None — process must be decarbonized first |
| Optimized low-C processing — confined dairy, 5% herd |
Méité et al. (2024) |
~1.5 Mt CO₂e/yr |
Low-C processing + renewable energy |
| Feedlot beef finishing |
Ridoutt (2022) |
~29 Mt CO₂e/yr |
Renewable energy; feedlot phase only |
| Pasture systems (~70% of global enteric CH₄) |
No LCA; no delivery mechanism |
Not calculable |
Delivery mechanism does not exist |
Table 2: Summary of achievable global mitigation potential based on current LCAs and models of Asparagopsis based methane inhibitors
Evidence Base
Under controlled conditions, seaweed-based additives — particularly
Asparagopsis taxiformis — can reduce enteric methane emissions by 40–90% in feedlot settings and up to 40% in grazing systems (
Kinley et al., 2020;
Roque et al., 2021, (Meo-Filho et al., 2024). However, the cradle-grave lifecycle picture paints a different picture.
Thomas et al. (2025) looked at 7 cradle-grave LCAs for beef, dairy and sheep and found 5 out of 7 scenarios worse than the unsupplemented baseline. For example in dairy cattle, the high energy demands of freeze-drying
Asparagopsis taxiformis (AT) under current conditions offset enteric methane savings entirely, producing a net greenhouse gas outcome
worse than the unsupplemented baseline.
Méité et al. (2024), modelling AT production from a Swedish land-based facility powered by a low-carbon grid and using a less-energy intensive drying system showed a pathway to reducing emissions: high-dose supplementation (1% of organic matter) achieves a 23% whole-system GWP reduction per litre of milk, even after accounting for non-supplemented calves and heifers. However,
Méité et al. (2024) also shows that standalone seaweed supplementation increases eutrophication and acidification even while reducing GWP.
Only a comprehensive emissions management program (including manure management) achieves simultaneous reductions across all three impact categories.
For beef cattle, sector-scale modeling by
Ridoutt et al. (2022) projected overall GHG reductions of 1–4% for the Australian beef industry by 2030 through feedlot adoption, equivalent to 0.6–2.0 Mt CO
2e. Applied proportionally across global beef production, a comparable adoption trajectory would represent potential reductions of approximately 20–65 Mt CO
2e globally — modest relative to the roughly 3.1 Gt CO
2e attributed to beef cattle annually. No ISO-compliant lifecycle analysis has yet been conducted for
Asparagopsis taxiformis in beef cattle to test whether this projection would survive full end-to-end accounting, and sector-level impact across all system types will be constrained by the dominance of pasture-based emissions, processing technology, and the practical challenge of consistent delivery outside feedlot settings. Delivery mechanism also matters:
boluses and
lick blocks may influence both effectiveness and practicality across system types (
Spark Solutions Livestock Enteric Methane Mitigation Roadmap, 2025).
Calculation
Dairy Cows
| Parameter |
Value |
Note |
| 2030 market size |
$153M |
50% of WB 2030 market size of $306M (assuming evenly between dairy and beef market) |
| Assumed price |
$0.5/cow per day or ~$180/cow per year |
Source: Agfunder |
| Cows supplemented |
~0.85 million cows ($153M/180) |
|
| Global dairy herd |
~270 million |
Source: WWF |
| Share of herd |
0.31% |
|
| Milk produced per cow per year |
~7100 L |
Source: FAO (data for German farms) |
| Reduction of emissions/liter |
0.24 kg CO₂e/L |
23% reduction in emissions per L of milk Source: Méité et al. (2024); Baseline ~1.04 kg CO₂e / L milk Thomas et al. (2025) |
| Gross mitigation at this scale |
~0.85M × 7,000 L/yr × 0.24 kg CO₂e/L = ~1.4 Mt CO₂e/yr |
|
Table 3: Calculation of mitigation potentials for confined dairy cows
Beef Finishing
| Parameter |
Value |
Note |
| Overall GHG reductions for Australian beef industry by 2030 using AT |
1-4% |
Sector-scale modeling by Ridoutt et al. (2022) (not an LCA) |
| Worldwide emissions from beef cattle |
2.9 GT |
Source: FAO |
| Gross mitigation at this scale |
1%*2.9 GT=~29 Mt CO₂e/yr |
|
Table 4: Calculation of mitigation potentials for beef in feedlot systems
Top-line summary
| Scenario |
Basis / Source |
Feasibility-adjusted (×0.75) Mt CO₂e/yr |
Key condition |
| Current pilot scale — freeze-drying, fossil grid |
Thomas et al. (2025) |
Increased emissions relative to baseline |
None — process must be decarbonized first |
| Optimized low-C processing — confined dairy, 5% herd |
Méité et al. (2024) |
~1.5 Mt CO₂e/yr |
Low-C processing + renewable energy |
| Feedlot beef finishing |
Ridoutt (2022) |
~29 Mt CO₂e/yr |
Renewable energy; feedlot phase only |
| Pasture systems (~70% of global enteric CH₄) |
No LCA; no delivery mechanism |
Not calculable |
Delivery mechanism does not exist |
Table 2: Summary of achievable global mitigation potential based on current LCAs and models of asparagopsis based methane inhibitors
Evidence Base
Under controlled conditions, seaweed-based additives — particularly
Asparagopsis taxiformis — can reduce enteric methane emissions by 40–90% in feedlot settings and up to 40% in grazing systems (
Kinley et al., 2020;
Roque et al., 2021, (Meo-Filho et al., 2024). However, the cradle-grave lifecycle picture paints a different picture.
Thomas et al. (2025) looked at 7 cradle-grave LCAs for beef, dairy and sheep and found 5 out of 7 scenarios worse than the unsupplemented baseline. For example in dairy cattle, the high energy demands of freeze-drying
Asparagopsis taxiformis (AT) under current conditions offset enteric methane savings entirely, producing a net greenhouse gas outcome
worse than the unsupplemented baseline.
Méité et al. (2024), modelling AT production from a Swedish land-based facility powered by a low-carbon grid and using a less-energy intensive drying system showed a pathway to reducing emissions: high-dose supplementation (1% of organic matter) achieves a 23% whole-system GWP reduction per litre of milk, even after accounting for non-supplemented calves and heifers. However,
Méité et al. (2024) also shows that standalone seaweed supplementation increases eutrophication and acidification even while reducing GWP.
Only a comprehensive emissions management program (including manure management) achieves simultaneous reductions across all three impact categories.
For beef cattle, sector-scale modeling by
Ridoutt et al. (2022) projected overall GHG reductions of 1–4% for the Australian beef industry by 2030 through feedlot adoption, equivalent to 0.6–2.0 Mt CO
2e. Applied proportionally across global beef production, a comparable adoption trajectory would represent potential reductions of approximately 20–65 Mt CO
2e globally — modest relative to the roughly 3.1 Gt CO
2e attributed to beef cattle annually. No ISO-compliant lifecycle analysis has yet been conducted for
Asparagopsis taxiformis in beef cattle to test whether this projection would survive full end-to-end accounting, and sector-level impact across all system types will be constrained by the dominance of pasture-based emissions, processing technology, and the practical challenge of consistent delivery outside feedlot settings. Delivery mechanism also matters:
boluses and
lick blocks may influence both effectiveness and practicality across system types (
Spark Solutions Livestock Enteric Methane Mitigation Roadmap, 2025).
Calculation
Dairy Cows
| Parameter |
Value |
Note |
| 2030 market size |
$153M |
50% of WB 2030 market size of $306M (assuming evenly between dairy and beef market) |
| Assumed price |
$0.5/cow per day or ~$180/cow per year |
Source: Agfunder |
| Cows supplemented |
~0.85 million cows ($153M/180) |
|
| Global dairy herd |
~270 million |
Source: WWF |
| Share of herd |
0.31% |
|
| Milk produced per cow per year |
~7100 L |
Source: FAO (data for German farms) |
| Reduction of emissions/liter |
0.24 kg CO₂e/L |
23% reduction in emissions per L of milk Source: Méité et al. (2024); Baseline ~1.04 kg CO₂e / L milk Thomas et al. (2025) |
| Gross mitigation at this scale |
~0.85M × 7,000 L/yr × 0.24 kg CO₂e/L = ~1.4 Mt CO₂e/yr |
|
Table 3: Calculation of mitigation potentials for confined dairy cows
Beef Finishing
| Parameter |
Value |
Note |
| Overall GHG reductions for Australian beef industry by 2030 using AT |
1-4% |
Sector-scale modeling by Ridoutt et al. (2022) (not an LCA) |
| Worldwide emissions from beef cattle |
2.9 GT |
Source: FAO |
| Gross mitigation at this scale |
1%*2.9 GT=~29 Mt CO₂e/yr |
|
Table 4: Calculation of mitigation potentials for beef in feedlot systems
Top-line summary
| Scenario |
Basis / Source |
Feasibility-adjusted (×0.75) Mt CO₂e/yr |
Key condition |
| Current pilot scale — freeze-drying, fossil grid |
Thomas et al. (2025) |
0 (net negative) |
None — process must be decarbonized first |
| Optimized low-C processing — confined dairy, 5% herd |
Méité et al. (2024) |
~1.5 Mt CO₂e/yr |
Low-C processing + renewable energy |
| Feedlot beef finishing |
Ridoutt (2022) |
~29 Mt CO₂e/yr |
Renewable energy; feedlot phase only |
| Pasture systems (~70% of global enteric CH₄) |
No LCA; no delivery mechanism |
Not calculable |
Delivery mechanism does not exist |
Table 2: Summary of achievable global mitigation potential based on current LCAs and models of asparagopsis based methane inhibitors
Evidence Base
Under controlled conditions, seaweed-based additives — particularly
Asparagopsis taxiformis — can reduce enteric methane emissions by 40–90% in feedlot settings and up to 40% in grazing systems (
Kinley et al., 2020;
Roque et al., 2021, (Meo-Filho et al., 2024). However, the cradle-grave lifecycle picture paints a different picture.
Thomas et al. (2025) looked at 7 cradle-grave LCAs for beef, dairy and sheep and found 5 out of 7 scenarios worse than the unsupplemented baseline. For example in dairy cattle, the high energy demands of freeze-drying
Asparagopsis taxiformis (AT) under current conditions offset enteric methane savings entirely, producing a net greenhouse gas outcome
worse than the unsupplemented baseline.
Méité et al. (2024), modelling AT production from a Swedish land-based facility powered by a low-carbon grid and using a less-energy intensive drying system showed a pathway to reducing emissions: high-dose supplementation (1% of organic matter) achieves a 23% whole-system GWP reduction per litre of milk, even after accounting for non-supplemented calves and heifers. However,
Méité et al. (2024) also shows that standalone seaweed supplementation increases eutrophication and acidification even while reducing GWP. Only the combination with manure management achieves simultaneous reductions across all three impact categories.
For beef cattle, sector-scale modeling by
Ridoutt et al. (2022) projected overall GHG reductions of 1–4% for the Australian beef industry by 2030 through feedlot adoption, equivalent to 0.6–2.0 Mt CO
2e. Applied proportionally across global beef production, a comparable adoption trajectory would represent potential reductions of approximately 20–65 Mt CO
2e globally — modest relative to the roughly 3.1 Gt CO
2e attributed to beef cattle annually. No ISO-compliant lifecycle analysis has yet been conducted for
Asparagopsis taxiformis in beef cattle to test whether this projection would survive full end-to-end accounting, and sector-level impact across all system types will be constrained by the dominance of pasture-based emissions, processing technology, and the practical challenge of consistent delivery outside feedlot settings. Delivery mechanism also matters:
boluses and
lick blocks may influence both effectiveness and practicality across system types (
Spark Solutions Livestock Enteric Methane Mitigation Roadmap, 2025).
Calculation
Dairy Cows
| Parameter |
Value |
Note |
| 2030 market size |
$153M |
50% of WB 2030 market size of $306M (assuming evenly between dairy and beef market) |
| Assumed price |
$0.5/cow per day or ~$180/cow per year |
Source: Agfunder |
| Cows supplemented |
~0.85 million cows ($153M/180) |
|
| Global dairy herd |
~270 million |
Source: WWF |
| Share of herd |
0.31% |
|
| Milk produced per cow per year |
~7100 L |
Source: FAO (data for German farms) |
| Reduction of emissions/liter |
0.24 kg CO₂e/L |
23% reduction in emissions per L of milk Source: Méité et al. (2024); Baseline ~1.04 kg CO₂e / L milk Thomas et al. (2025) |
| Gross mitigation at this scale |
~0.85M × 7,000 L/yr × 0.24 kg CO₂e/L = ~1.4 Mt CO₂e/yr |
|
Table 3: Calculation of mitigation potentials for confined dairy cows
Beef Finishing
| Parameter |
Value |
Note |
| Overall GHG reductions for Australian beef industry by 2030 using AT |
1-4% |
Sector-scale modeling by Ridoutt et al. (2022) (not an LCA) |
| Worldwide emissions from beef cattle |
2.9 GT |
Source: FAO |
| Gross mitigation at this scale |
1%*2.9 GT=~29 Mt CO₂e/yr |
|
Table 4: Calculation of mitigation potentials for beef in feedlot systems
Top-line summary
| Scenario |
Basis / Source |
Feasibility-adjusted (×0.75) Mt CO₂e/yr |
Key condition |
| Current pilot scale — freeze-drying, fossil grid |
Thomas et al. (2025) |
0 (net negative) |
None — process must be decarbonized first |
| Optimized low-C processing — confined dairy, 5% herd |
Méité et al. (2024) |
~1.5 Mt CO₂e/yr |
Low-C processing + renewable energy |
| Feedlot beef finishing |
Ridoutt (2022) |
~29 Mt CO₂e/yr |
Renewable energy; feedlot phase only |
| Pasture systems (~70% of global enteric CH₄) |
No LCA; no delivery mechanism |
Not calculable |
Delivery mechanism does not exist |
Evidence Base
Under controlled conditions, seaweed-based additives — particularly
Asparagopsis taxiformis — can reduce enteric methane emissions by 40–90% in feedlot settings and up to 40% in grazing systems (
Kinley et al., 2020;
Roque et al., 2021, (Meo-Filho et al., 2024). However, the cradle-grave lifecycle picture paints a different picture.
Thomas et al. (2025) looked at 7 cradle-grave LCAs for beef, dairy and sheep and found 5 out of 7 scenarios worse than the unsupplemented baseline. For example in dairy cattle, the high energy demands of freeze-drying
Asparagopsis taxiformis (AT) under current conditions offset enteric methane savings entirely, producing a net greenhouse gas outcome
worse than the unsupplemented baseline.
Méité et al. (2024), modelling AT production from a Swedish land-based facility powered by a low-carbon grid and using a less-energy intensive drying system showed a pathway to reducing emissions: high-dose supplementation (1% of organic matter) achieves a 23% whole-system GWP reduction per litre of milk, even after accounting for non-supplemented calves and heifers. However,
Méité et al. (2024) also shows that standalone seaweed supplementation increases eutrophication and acidification even while reducing GWP. Only the combination with manure management achieves simultaneous reductions across all three impact categories.
For beef cattle, sector-scale modeling by
Ridoutt et al. (2022) projected overall GHG reductions of 1–4% for the Australian beef industry by 2030 through feedlot adoption, equivalent to 0.6–2.0 Mt CO
2e. Applied proportionally across global beef production, a comparable adoption trajectory would represent potential reductions of approximately 20–65 Mt CO
2e globally — modest relative to the roughly 3.1 Gt CO
2e attributed to beef cattle annually. No ISO-compliant lifecycle analysis has yet been conducted for
Asparagopsis taxiformis in beef cattle to test whether this projection would survive full end-to-end accounting, and sector-level impact across all system types will be constrained by the dominance of pasture-based emissions, processing technology, and the practical challenge of consistent delivery outside feedlot settings. Delivery mechanism also matters:
boluses and
lick blocks may influence both effectiveness and practicality across system types (
Spark Solutions Livestock Enteric Methane Mitigation Roadmap, 2025).
Calculation
Dairy Cows
| Parameter |
Value |
Note |
| 2030 market size |
$153M |
50% of WB 2030 market size of $306M (assuming evenly between dairy and beef market) |
| Assumed price |
$0.5/cow per day or ~$180/cow per year |
Source: Agfunder |
| Cows supplemented |
~0.85 million cows ($153M/180) |
|
| Global dairy herd |
~270 million |
Source: WWF |
| Share of herd |
0.31% |
|
| Milk produced per cow per year |
~7100 L |
Source: FAO (data for German farms) |
| Reduction of emissions/liter |
0.24 kg CO₂e/L |
23% reduction in emissions per L of milk Source: Méité et al. (2024); Baseline ~1.04 kg CO₂e / L milk Thomas et al. (2025) |
| Gross mitigation at this scale |
~0.85M × 7,000 L/yr × 0.24 kg CO₂e/L = ~1.4 Mt CO₂e/yr |
|
Beef Finishing
| Parameter |
Value |
Note |
| Overall GHG reductions for Australian beef industry by 2030 using AT |
1-4% |
Sector-scale modeling by Ridoutt et al. (2022) (not an LCA) |
| Worldwide emissions from beef cattle |
2.9 GT |
Source: FAO |
| Gross mitigation at this scale |
1%*2.9 GT=~29 Mt CO₂e/yr |
|
Top-line summary
| Scenario |
Basis / Source |
Feasibility-adjusted (×0.75) Mt CO₂e/yr |
Key condition |
| Current pilot scale — freeze-drying, fossil grid |
Thomas et al. (2025) |
0 (net negative) |
None — process must be decarbonized first |
| Optimized low-C processing — confined dairy, 5% herd |
Méité et al. (2024) |
~1.5 Mt CO₂e/yr |
Low-C processing + renewable energy |
| Feedlot beef finishing |
Ridoutt (2022) |
~29 Mt CO₂e/yr |
Renewable energy; feedlot phase only |
| Pasture systems (~70% of global enteric CH₄) |
No LCA; no delivery mechanism |
Not calculable |
Delivery mechanism does not exist |
Evidence Base
Under controlled conditions, seaweed-based additives — particularly
Asparagopsis taxiformis — can reduce enteric methane emissions by 40–90% in feedlot settings and up to 40% in grazing systems. (
Kinley et al., 2020;
Roque et al., 2021, (Meo-Filho et al., 2024). However, the cradle-grave lifecycle picture paints a different picture.
Thomas et al. (2025) looked at 7 cradle-grave LCAs for beef, dairy and sheep and found 5 out of 7 scenarios worse than the unsupplemented baseline. For example in dairy cattle, the high energy demands of freeze-drying
Asparagopsis taxiformis (AT) under current conditions offset enteric methane savings entirely, producing a net greenhouse gas outcome
worse than the unsupplemented baseline.
Méité et al. (2024), modelling AT production from a Swedish land-based facility powered by a low-carbon grid and using a less-energy intensive drying system showed a pathway to reducing emissions: high-dose supplementation (1% of organic matter) achieves a 23% whole-system GWP reduction per litre of milk, even after accounting for non-supplemented calves and heifers.
However, Méité et al. (2024) also shows that standalone seaweed supplementation increases eutrophication and acidification even while reducing GWP. Only the combination with manure management achieves simultaneous reductions across all three impact categories.
For beef cattle, sector-scale modeling by
Ridoutt et al. (2022) projected overall GHG reductions of 1–4% for the Australian beef industry by 2030 through feedlot adoption, equivalent to 0.6–2.0 Mt CO
2e. Applied proportionally across global beef production, a comparable adoption trajectory would represent potential reductions of approximately
20–65 Mt CO2e globally — modest relative to the roughly 3.1 Gt CO
2e attributed to beef cattle annually. No ISO-compliant lifecycle analysis has yet been conducted for
Asparagopsis taxiformis in beef cattle to test whether this projection would survive full end-to-end accounting, and sector-level impact across all system types will be constrained by the dominance of pasture-based emissions, processing technology, and the practical challenge of consistent delivery outside feedlot settings. Delivery mechanism also matters:
boluses and
lick blocks may influence both effectiveness and practicality across system types (
Spark Solutions Livestock Enteric Methane Mitigation Roadmap, 2025).
Calculation
Dairy Cows
| Parameter |
Value |
Note |
| 2030 market size |
$153M |
50% of WB 2030 market size of $306M (assuming evenly between dairy and beef market) |
| Assumed price |
$0.5/cow per day or ~$180/cow per year |
Source: Agfunder |
| Cows supplemented |
~0.85 million cows ($153M/180) |
|
| Global dairy herd |
~270 million |
Source: WWF |
| Share of herd |
0.31% |
|
| Milk produced per cow per year |
~7100 L |
Source: FAO (data for German farms) |
| Reduction of emissions/liter |
0.24 kg CO₂e/L |
23% reduction in emissions per L of milk Source: Méité et al. (2024); Baseline ~1.04 kg CO₂e / L milk Thomas et al. (2025) |
| Gross mitigation at this scale |
~0.85M × 7,000 L/yr × 0.24 kg CO₂e/L = ~1.4 Mt CO₂e/yr |
|
Beef Finishing
| Parameter |
Value |
Note |
| Overall GHG reductions for Australian beef industry by 2030 using AT |
1-4% |
Sector-scale modeling by Ridoutt et al. (2022) (not an LCA) |
| Worldwide emissions from beef cattle |
2.9 GT |
Source: FAO |
| Gross mitigation at this scale |
1%*2.9 GT=~29 Mt CO₂e/yr |
|
Top-line summary
Under controlled conditions, seaweed-based additives — particularly
Asparagopsis taxiformis — can reduce enteric methane emissions by 40–90% in feedlot settings and up to 40% in grazing systems. (
Kinley et al., 2020;
Roque et al., 2021, (Meo-Filho et al., 2024). However, the cradle-grave lifecycle picture paints a different picture.
For dairy cattle, in a cradle-to-grave lifecycle analysis,
Thomas et al. (2025) found that the high energy demands of freeze-drying
Asparagopsis taxiformis under current conditions offset enteric methane savings entirely, producing a net greenhouse gas outcome
worse than the unsupplemented baseline. For beef cattle, the picture is more optimistic: sector-scale modeling by
Ridoutt et al. (2022) projected overall GHG reductions of 1–4% for the Australian beef industry by 2030 through feedlot adoption, equivalent to 0.6–2.0 Mt CO
2e. Applied proportionally across global beef production, a comparable adoption trajectory would represent potential reductions of approximately
20–65 Mt CO2e globally — modest relative to the roughly 3.1 Gt CO
2e attributed to beef cattle annually (FAO, 2023), but meaningful in absolute terms. No ISO-compliant lifecycle analysis has yet been conducted for
Asparagopsis taxiformis in beef cattle to test whether this projection would survive full end-to-end accounting, and sector-level impact across all system types will be constrained by the dominance of pasture-based emissions, processing technology, and the practical challenge of consistent delivery outside feedlot settings.
What trial evidence shows
Several studies have examined the impact of seaweed inclusion in cattle feed. The most promising results come from
Asparagopsis taxiformis trials in feedlot systems, where methane reductions of 80–90% have been recorded (
Kinley et al., 2020;
Roque et al., 2021). In grazing systems, the same species has shown reductions of around 37% (
Meo-Filho et al., 2024) — a meaningful but substantially lower ceiling, likely reflecting lower additive uptake in a less controlled feeding environment. It is important to note that the strongest results come predominantly from feedlot and mixed systems, which represent less than 30% of global enteric methane emissions; extrapolating these figures to sector-wide impact requires caution.
A recent meta-analysis of bromoform-containing seaweeds and synthetic bromoform-based additives (
Kebreab et al., 2025), at an average dose of approximately 28.3 mg/kg of feed consumed, found that methane production (g/day) was reduced by 47.3%, methane yield (g/kg dry feed) by 43.3%, and methane intensity (g/kg of product) by 39.0%. Efficacy varied by cattle type — with greater reductions in beef than dairy cattle — and by diet, with starch-rich rations showing larger reductions than forage-based diets.
However, results across the literature are highly variable (
Hegarty et al., 2021), and durability remains uncertain, with effectiveness potentially declining over time (
Stefenoni et al., 2021;
Angellotti et al., 2025). Delivery mechanism also matters:
boluses and
lick blocks may influence both effectiveness and practicality across system types (
Spark Solutions Livestock Enteric Methane Mitigation Roadmap, 2025).
Lifecycle and sector-scale estimates
As of December 2024, only three studies have applied lifecycle assessment (LCA) methods to evaluate the combined production and emission reduction impacts of seaweed feed supplements in ruminant systems — a remarkably thin evidence base given the volume of in vivo trial literature. Two of these,
Méité et al. (2024) and
Thomas et al. (2025), extend into the full livestock system; the third,
Nilsson & Martin (2022), covers only the production stage up to the processing gate. All three use European systems and pilot-scale production data.
The table below summarizes the state of end-to-end LCA evidence across system types and species. The most striking feature is how many cells are empty.
|
Pasture beef |
Mixed beef |
Feedlot beef |
Pasture dairy |
Mixed dairy |
Feedlot dairy |
| Asparagopsis taxiformis |
No LCA. In vivo only: 37–40% enteric CH4 reduction (Meo-Filho 2024; Kebreab 2024) |
No LCA. No in vivo data |
No LCA. In vivo only: 80–90% enteric CH4 reduction (Kinley 2020; Roque 2021). Sector modelling only: 1–4% sector GHG reduction (Ridoutt 2022 — not ISO-compliant) |
LCA exists (Méité et al. 2024): 23% net GWP reduction at high supplementation (191 g/day), cradle-to-farm-gate |
No LCA. No in vivo data |
Partial LCA exists (Thomas et al. 2025, S4): 59.8% enteric CH4 reduction in lactating cows; ~7–9% system-level; net GWP worse than baseline end-to-end under current freeze-drying supply chain |
| Other seaweeds (AN, LH) |
No LCA. No in vivo data |
No LCA. No in vivo data |
LCA exists (Thomas et al. 2025, S1/S2): AN whole 4% enteric, net marginally worse than baseline; AN refined 9% enteric, net significantly worse than baseline due to freeze-drying |
No LCA. No in vivo data |
No LCA. No in vivo data |
LCA exists (Thomas et al. 2025, S3): AN refined Harter-dried, 9% enteric in lactating cows, 4% system-level, net worse than baseline end-to-end |
Table 2. Evidence base for end-to-end lifecycle assessment (LCA) of seaweed-based methane inhibitors across cattle systems and species (showing where LCA and in vivo evidence exist vs. gaps).
AN =
Ascophyllum nodosum; LH =
Laminaria hyperborea alginate residue; GWP = global warming potential; ISO-compliant = full system boundary and inventory per ISO 14040/44.
First, the step-down from in vivo efficacy to whole-system impact is steep and consistent.
Méité et al. found that AT's 65.5% enteric methane reduction in lactating dairy cows translated to only a 23% net reduction in whole-system GWP — because enteric methane is only one component of total livestock emissions, and non-supplemented animals within the herd boundary dilute the apparent system gain.
Thomas et al. found that AT's 59.8% in vivo reduction shrank to approximately 7–9% at the system level for the same reason. Neither figure appears prominently in the broader literature on seaweed's methane mitigation potential.
Second, processing technology is the dominant variable determining whether any net climate benefit survives to the end-to-end level — more so than species selection or in vivo efficacy.
Thomas et al.'s AN whole scenario (S1, barn-dried) and AN refined scenario (S2, freeze-dried) achieve similar enteric reductions of 4% and 9% respectively, but their lifecycle footprints are completely different: in S2, algae processing alone accounts for roughly half of total system climate impact, driven entirely by the energy demands of freeze-drying. The same pattern holds across AT (S4) and AN refined in dairy and sheep scenarios. The one positive end-to-end result in the published literature —
Méité et al.'s 23% reduction — reflects an assumption of less energy-intensive drying that
Thomas et al. regard as optimistic relative to observed pilot-scale production data. Decarbonizing the processing step, through renewable energy, lower-impact drying methods, or valorization of processing by-products, is therefore a prerequisite for seaweed additives to deliver meaningful net lifecycle benefits.
Third, and most consequentially for investment prioritisation, the commercially most important deployment scenario —
A. taxiformis in feedlot beef, where in vivo efficacy is highest and delivery into total mixed rations is most practical — is precisely the scenario for which no end-to-end LCA exists.
Ridoutt et al. (2022) modelled sector-level GHG reductions for AT in Australian feedlots, projecting 1–4% sector reductions by 2030, but this was not an ISO-compliant LCA and covered only the feedlot finishing phase, excluding the pasture phases that precede feedlot entry and which account for the majority of lifetime emissions. Pasture and mixed systems for both beef and dairy are almost entirely uncharacterised at the lifecycle level regardless of species — a critical gap given that these systems account for the large majority of global enteric methane emissions.
Taken together, the evidence suggests that seaweed additives have genuine mitigation potential in confined systems with optimized low-carbon processing and delivery, but that sector-level impact will be constrained by the dominance of pasture-based emissions, lifecycle processing costs, the practical challenge of consistent delivery outside feedlot settings, and an LCA evidence base that remains far too narrow to support confident sector-wide projections.
Top-line summary
Under controlled conditions, seaweed-based additives — particularly
Asparagopsis taxiformis — can reduce enteric methane emissions by 40–90% in feedlot settings and up to 40% in grazing systems. However, the lifecycle picture paints a different picture.
For dairy cattle, in a cradle-to-grave lifecycle analysis,
Thomas et al. (2025) found that the high energy demands of freeze-drying
Asparagopsis taxiformis under current conditions offset enteric methane savings entirely, producing a net greenhouse gas outcome
worse than the unsupplemented baseline. For beef cattle, the picture is more optimistic: sector-scale modeling by
Ridoutt et al. (2022) projected overall GHG reductions of 1–4% for the Australian beef industry by 2030 through feedlot adoption, equivalent to 0.6–2.0 Mt CO
2e. Applied proportionally across global beef production, a comparable adoption trajectory would represent potential reductions of approximately
20–65 Mt CO2e globally — modest relative to the roughly 3.1 Gt CO
2e attributed to beef cattle annually (FAO, 2023), but meaningful in absolute terms. No ISO-compliant lifecycle analysis has yet been conducted for
Asparagopsis taxiformis in beef cattle to test whether this projection would survive full end-to-end accounting, and sector-level impact across all system types will be constrained by the dominance of pasture-based emissions, processing technology, and the practical challenge of consistent delivery outside feedlot settings.
What trial evidence shows
Several studies have examined the impact of seaweed inclusion in cattle feed. The most promising results come from
Asparagopsis taxiformis trials in feedlot systems, where methane reductions of 80–90% have been recorded (
Kinley et al., 2020;
Roque et al., 2021). In grazing systems, the same species has shown reductions of around 37% (
Meo-Filho et al., 2024) — a meaningful but substantially lower ceiling, likely reflecting lower additive uptake in a less controlled feeding environment. It is important to note that the strongest results come predominantly from feedlot and mixed systems, which represent less than 30% of global enteric methane emissions; extrapolating these figures to sector-wide impact requires caution.
A recent meta-analysis of bromoform-containing seaweeds and synthetic bromoform-based additives (
Kebreab et al., 2025), at an average dose of approximately 28.3 mg/kg of feed consumed, found that methane production (g/day) was reduced by 47.3%, methane yield (g/kg dry feed) by 43.3%, and methane intensity (g/kg of product) by 39.0%. Efficacy varied by cattle type — with greater reductions in beef than dairy cattle — and by diet, with starch-rich rations showing larger reductions than forage-based diets.
However, results across the literature are highly variable (
Hegarty et al., 2021), and durability remains uncertain, with effectiveness potentially declining over time (
Stefenoni et al., 2021;
Angellotti et al., 2025). Delivery mechanism also matters:
boluses and
lick blocks may influence both effectiveness and practicality across system types (
Spark Solutions Livestock Enteric Methane Mitigation Roadmap, 2025).
Lifecycle and sector-scale estimates
As of December 2024, only three studies have applied lifecycle assessment (LCA) methods to evaluate the combined production and emission reduction impacts of seaweed feed supplements in ruminant systems — a remarkably thin evidence base given the volume of in vivo trial literature. Two of these,
Méité et al. (2024) and
Thomas et al. (2025), extend into the full livestock system; the third,
Nilsson & Martin (2022), covers only the production stage up to the processing gate. All three use European systems and pilot-scale production data.
The table below summarizes the state of end-to-end LCA evidence across system types and species. The most striking feature is how many cells are empty.
| |
Pasture beef |
Mixed beef |
Feedlot beef |
Pasture dairy |
Mixed dairy |
Feedlot dairy |
| Asparagopsis taxiformis |
No LCA. In vivo only: 37–40% enteric CH4 reduction (Meo-Filho 2024; Kebreab 2024) |
No LCA. No in vivo data |
No LCA. In vivo only: 80–90% enteric CH4 reduction (Kinley 2020; Roque 2021). Sector modelling only: 1–4% sector GHG reduction (Ridoutt 2022 — not ISO-compliant) |
LCA exists (Méité et al. 2024): 23% net GWP reduction at high supplementation (191 g/day), cradle-to-farm-gate |
No LCA. No in vivo data |
Partial LCA exists (Thomas et al. 2025, S4): 59.8% enteric CH4 reduction in lactating cows; ~7–9% system-level; net GWP worse than baseline end-to-end under current freeze-drying supply chain |
| Other seaweeds (AN, LH) |
No LCA. No in vivo data |
No LCA. No in vivo data |
LCA exists (Thomas et al. 2025, S1/S2): AN whole 4% enteric, net marginally worse than baseline; AN refined 9% enteric, net significantly worse than baseline due to freeze-drying |
No LCA. No in vivo data |
No LCA. No in vivo data |
LCA exists (Thomas et al. 2025, S3): AN refined Harter-dried, 9% enteric in lactating cows, 4% system-level, net worse than baseline end-to-end |
Table 2. Evidence base for end-to-end lifecycle assessment (LCA) of seaweed-based methane inhibitors across cattle systems and species (showing where LCA and in vivo evidence exist vs. gaps).
AN =
Ascophyllum nodosum; LH =
Laminaria hyperborea alginate residue; GWP = global warming potential; ISO-compliant = full system boundary and inventory per ISO 14040/44.
First, the step-down from in vivo efficacy to whole-system impact is steep and consistent.
Méité et al. found that AT's 65.5% enteric methane reduction in lactating dairy cows translated to only a 23% net reduction in whole-system GWP — because enteric methane is only one component of total livestock emissions, and non-supplemented animals within the herd boundary dilute the apparent system gain.
Thomas et al. found that AT's 59.8% in vivo reduction shrank to approximately 7–9% at the system level for the same reason. Neither figure appears prominently in the broader literature on seaweed's methane mitigation potential.
Second, processing technology is the dominant variable determining whether any net climate benefit survives to the end-to-end level — more so than species selection or in vivo efficacy.
Thomas et al.'s AN whole scenario (S1, barn-dried) and AN refined scenario (S2, freeze-dried) achieve similar enteric reductions of 4% and 9% respectively, but their lifecycle footprints are completely different: in S2, algae processing alone accounts for roughly half of total system climate impact, driven entirely by the energy demands of freeze-drying. The same pattern holds across AT (S4) and AN refined in dairy and sheep scenarios. The one positive end-to-end result in the published literature —
Méité et al.'s 23% reduction — reflects an assumption of less energy-intensive drying that
Thomas et al. regard as optimistic relative to observed pilot-scale production data. Decarbonizing the processing step, through renewable energy, lower-impact drying methods, or valorization of processing by-products, is therefore a prerequisite for seaweed additives to deliver meaningful net lifecycle benefits.
Third, and most consequentially for investment prioritisation, the commercially most important deployment scenario —
A. taxiformis in feedlot beef, where in vivo efficacy is highest and delivery into total mixed rations is most practical — is precisely the scenario for which no end-to-end LCA exists.
Ridoutt et al. (2022) modelled sector-level GHG reductions for AT in Australian feedlots, projecting 1–4% sector reductions by 2030, but this was not an ISO-compliant LCA and covered only the feedlot finishing phase, excluding the pasture phases that precede feedlot entry and which account for the majority of lifetime emissions. Pasture and mixed systems for both beef and dairy are almost entirely uncharacterised at the lifecycle level regardless of species — a critical gap given that these systems account for the large majority of global enteric methane emissions.
Taken together, the evidence suggests that seaweed additives have genuine mitigation potential in confined systems with optimized low-carbon processing and delivery, but that sector-level impact will be constrained by the dominance of pasture-based emissions, lifecycle processing costs, the practical challenge of consistent delivery outside feedlot settings, and an LCA evidence base that remains far too narrow to support confident sector-wide projections.
Projects from Ocean CDR Community
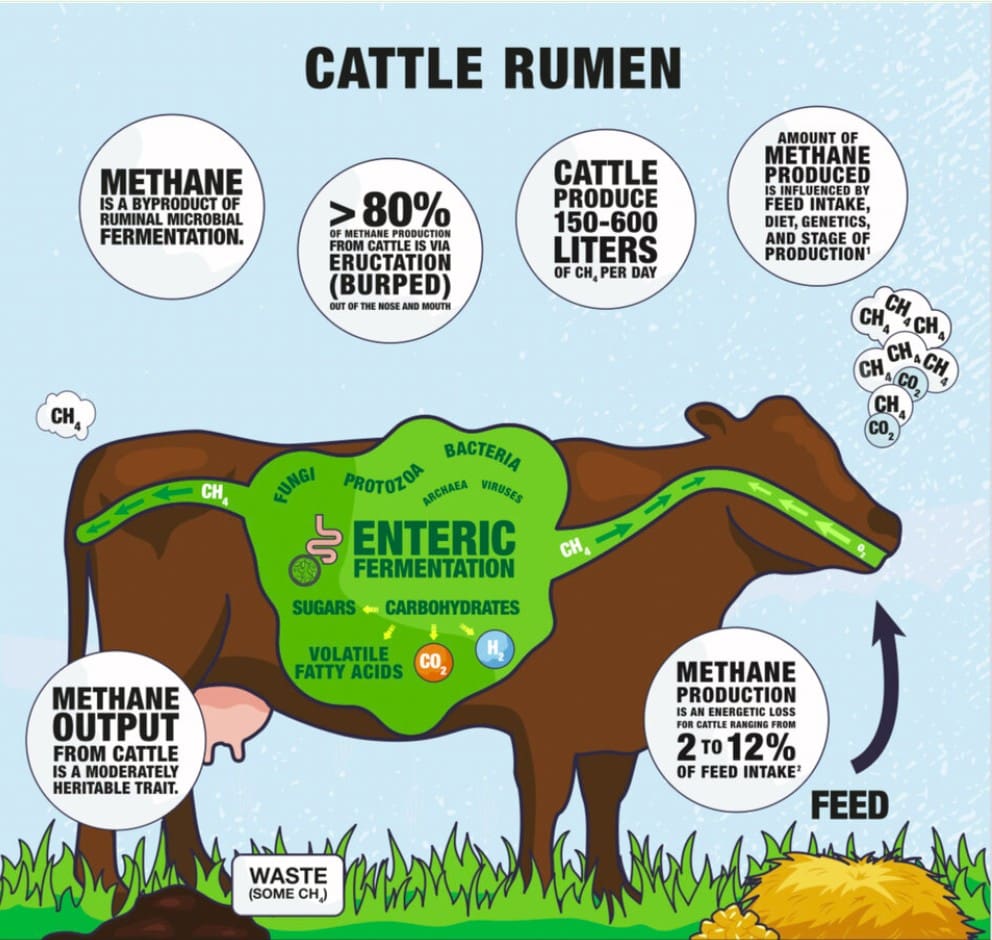
 Figure 1. Enteric fermentation in the rumen: microbial pathways that convert feed carbohydrates to methane (CH₄), released primarily via eructation (burping). Source: University of Nebraska Lincoln Institute of Agriculture and Natural Resources


How to submit comments:
Thanks for helping to advance these roadmaps. Here is how it works!
Or, send general feedback to info@oceanvisions.org
All submitted comments will be reviewed by the Ocean Visions team to ensure that they are true, verifiable, and additive before being added to the road maps. You can increase the likelihood that your comments will be incorporated into the road maps by providing references (where appropriate).